ALP wins 34% primary vote, 94 seats, Albo heralds himself as the GOAT.
— noobfromcnh (@songminfang) August 3, 2026
If @OneNationAus gets 35% or more of the primary vote and can't form government due to major party preferences, the average punter will start rioting https://t.co/lzrs1hJYSh
The Grand Western Experiment to Encircle the Sino-Russian Axis
The Great Western
Encirclement
Two Strategies, One Target. How the West’s competing visions for containing China and Russia are reshaping the global order, and why Beijing sees them as two faces of the same threat.
西方双重包围:两种战略,同一个目标
一种寻求以印度为支点、加固北约东翼的陆权包围。另一种要斩断霍尔木兹海峡、以能源绞杀中国工业。北京认为,这是同一场战争的两条战线。
- India as southern anchor: population larger than China’s, third largest economy trajectory, tying down Beijing in South Asia
- Network not alliance: defence pacts with Australia, New Zealand, Indonesia, Japan, Vietnam, a “first island chain on steroids” into the Indian Ocean
- NATO India dialogue: Atlantic Council urged ad hoc issue-by-issue dialogue, overlapping concerns on China
- Russian front: hardened buffer Baltic to Black Sea to Caucasus, Poland and Baltics as frontline
- Hormuz gambit: 27% of maritime oil and 20% of LNG transit the strait, overwhelmingly to Asia
- 2026 Iran war as template: strikes on Iran, strait closure, energy shock whose real target analysts say was China
- China exposure: bought over 80% of Iran’s shipped oil in 2025, significant Hormuz dependence
- Petrostate vs electrostate: US LNG coercion and renewable cuts vs China’s two decade solar, battery and EV dominance
A multi-theater containment built by a divided West
There is a strategic logic emerging in Western capitals that Beijing and Moscow have come to understand, even if Western policymakers rarely articulate it in full: a multi-theater containment architecture designed to limit continental power across Eurasia, in favor of the maritime powers. What makes this moment different from Cold War containment is that the West itself is divided on how to execute it.
Broadly, two competing visions have crystallized. One, the Eurasian Land Strategy, seeks to build up India as a southern counterweight to China while hardening NATO’s eastern frontier against Russia. The other, the Maritime-Energy Strategy, aims to decapitate Iran’s regime, seize control of the Strait of Hormuz, and weaponize energy flows to throttle China’s industrial machine. Both target the same adversary. Neither trusts the other to get it right.
The Left’s Eurasian Land Strategy
This vision treats the problem as fundamentally territorial and alliance based. Its logic runs through the map of Eurasia: if China is to be contained, it must be contained on land as well as at sea. And if Russia is to be rolled back, it must be confronted from the Baltic to the Black Sea to the Caucasus.
The centerpiece is India. With a population now larger than China’s and an economy on track to become the world’s third largest, India represents the only plausible continental counterweight to Chinese power in Asia.
The architecture is already taking shape. Modi’s government has stitched together cooperative defence agreements with Australia, New Zealand, Indonesia, Japan, and Vietnam, not a formal alliance, but a “first island chain on steroids” that extends China’s containment from the Pacific into the Indian Ocean.
NATO, for its part, has been explicit. An Atlantic Council report urged the Alliance to explore “an ad hoc, issue-by-issue dialogue with India,” noting that New Delhi “shares overlapping concerns regarding Chinese actions and intentions” even if it has not sought deeper formal partnership.
“If India fails, it could seriously jeopardize the U.S. Indo-Pacific strategy” and even raise “the possibility of war between two nuclear-armed powers.”
Simultaneously, this strategy treats Russia as a problem to be solved through forward defence. The war in Ukraine is not merely about Ukrainian sovereignty, it is about whether NATO can establish a hardened buffer along Russia’s entire western periphery. Poland and the Baltic states have become the new frontline, while the Caucasus, Georgia, Armenia, Azerbaijan, represents the southern hinge of the containment arc.
Norwegian intelligence assessed in early 2025 that “Russia and China are seeking a geopolitical division into spheres of influence,” viewing the transatlantic partnership as fracturing. The response, from this perspective, is to ensure it does not fracture, by making the eastern flank impregnable.
Hardened buffer, Baltic states and Poland as new frontline. NATO forward presence tripwired.
Test case for whether the buffer holds. Sovereignty and strategic depth in one.
Georgia, Armenia, Azerbaijan, the southern hinge where European and Asian theatres meet.
The Right’s Maritime-Energy Strategy
The second vision is less interested in land alliances and more interested in chokepoints. Its proponents argue that China’s power is not primarily military but industrial, and industry runs on energy. Cut the energy, and you do not need to contain China, you weaken it from within.
Its focal point is Iran and the Strait of Hormuz. Roughly 27% of global maritime oil trade and 20% of world LNG shipments transit this narrow waterway, with the overwhelming majority directed to Asian markets.
The 2026 Iran war brought this theory into practice. U.S. and Israeli strikes killed Iran’s Supreme Leader and effectively closed the strait, sending global energy markets into crisis. But the strategic target was never just Tehran. As one analysis put it: “All flashpoints are connected dots in a strategy that aims to concentrate all efforts on China and the Indo-Pacific.”
China, after all, purchased over 80% of Iran’s shipped oil in 2025 and relied on Hormuz transited supplies for a significant portion of its energy imports.
“China built a stranglehold over critical supply chains to deter the US. But the Gulf war may have given the US a reciprocal lever over China’s supply chain.”
There is a deeper geoeconomic dimension. The Trump administration’s approach, coercing allies to buy American LNG while cutting federal renewable funding, reflects a bet on the “petrostate” model. Meanwhile, China has spent two decades building an “electrostate,” dominating solar, batteries, and EVs.
Two strategies in tension, not in concert
These two strategies are not complementary. They are in tension.
The Eurasian Land Strategy requires stability in the Middle East. A war in Iran that closes Hormuz disrupts global energy markets, alienates partners like India (which depends on Gulf oil), and risks pushing energy importing nations deeper into China’s arms, precisely what we saw when the Philippines, a U.S. ally, accelerated renewable projects that deepened its dependence on Chinese technology.
Conversely, the Maritime-Energy Strategy undermines the Eurasian Land Strategy by diverting resources and attention away from Europe and India. If the U.S. is bogged down in the Persian Gulf, it cannot adequately reinforce NATO’s eastern flank or the Indo-Pacific simultaneously.
Chinese state media has condemned “attempts to push for NATO-like alliances in the Asia-Pacific” as “kidnapping regional countries,” while deepening ties with Russia, Iran, and North Korea to ensure pressure in one theatre can be met with resistance in another.
Two prongs, one assault on multipolarity
To Beijing and Moscow, these are not two separate strategies. They are two prongs of the same Western assault on the emerging multipolar order.
The U.S.-China Economic and Security Review Commission documents how China, Russia, Iran, and North Korea increasingly coordinate, not as a formal bloc, but as a network where conflict in one theatre creates openings in another.
Russia does not want to be seen fomenting an Iran war, given defence ties with Tehran and commercial relationships with Gulf states, but Moscow understands Hormuz disruptions would make Russian energy exports “much more desired.”
Systematically reduced fossil dependence, oil and gas through Hormuz now roughly 6% of total energy, down sharply, while building alternative routes through North Africa and Central Asia. The electrostate is the exit ramp.
From Beijing’s perspective the division is visible and exploitable. Any Western pressure in one theatre can be met with resistance in another, precisely the “opportunistic aggression” the West fears in reverse.
Who is the West when it tries to encircle?
The great western encirclement, whether conceived as a land based alliance architecture or a maritime energy blockade, faces a single insurmountable problem: the West is no longer unified enough to execute either strategy cleanly.
Norwegian intelligence noted that Russia and China “share the view that the West in general, and the transatlantic partnership in particular, are fracturing.”
The “left” strategy requires long term alliance building and patient investment in partners like India. The “right” strategy requires short term coercion, unilateral military action, and a willingness to tolerate global economic disruption. They demand different Americas, one that leads through institutions, and one that leads through energy markets and carrier strike groups.
Until the West chooses, or finds a way to synthesize these approaches, the encirclement will remain half built. And Beijing, watching from the outside, will continue to exploit the gap.
Until the West chooses, the encirclement remains half built.
The land arc needs decades. The energy arc needs a crisis. One demands a steady hand, the other a closed fist. Beijing’s wager is that the West cannot be both at once.
陆权需数十年,海权需一场危机。一个要稳手,一个要紧拳。北京赌的是,西方无法同时做到。Who Got to Australia First: A Census of Arrivals, Group by Group
Who Got to Australia First: A Census of Arrivals, Group by Group
Before every community was a first person, a recorded name, a ship, a year. This is the order of arrival behind the modern Census table.
50,000+ years of continuous presence, established by archaeological and genetic evidence long before any recorded ship.
The order of arrival
Rows are sorted by the year of the first confirmed arrival, and the first recorded person is named where a name survives. Where a “first” is contested, or no name was ever logged, it is flagged.
| Group | First confirmed arrival | First major wave | 2026 Census presence |
|---|---|---|---|
| Indigenous Australians | 50,000+ yrs First Nations — no single “first” person | Original inhabitants | ~800,000+ |
| 1788 Captain Arthur Phillip, First Fleet | First Fleet, then mass migration 1820s-1860s | ~11.8 million (English ~8.4m; Scottish ~2.4m; Irish ~2.4m; Welsh ~0.6m) | |
| 1788 German convicts (names lost); first named settler Johann Justus, 1838 | Lutheran settlers to South Australia, Barossa | ~1 million ancestry | |
| 1788 Giuseppe Tuzi, First Fleet convict | Sojourners 1890s-1920s; mass postwar migration | ~1.1 million ancestry | |
| 1790 John Pace, transportee (earliest possible, disputed) | Post-WWII assisted migration | ~220,000 ancestry | |
| 1793 Tuki Tahua & Ngahuruhuru, taken to Norfolk Island | South Sea Islanders 1860s; NZ and Pacific migration later | ~350,000 ancestry | |
| 1818 Mak Sai Ying (John Shying), free settler | Gold rush 1848-1850s, then again post-1980s | ~1.3 million ancestry | |
| 1829 Katerina Plessos, among seven Greek convicts | Postwar migration 1940s-1950s | ~440,000 ancestry | |
| 1800s “Manila men” pearl divers of Broome; 700 recorded by 1901 (no single name) | Whalers and luggers; significant from 1970s | ~400,000 ancestry | |
| 1850s Gold-rush miners (no name); Baccich & Jurich, 1875 shipwreck survivors | Assisted migration 1950s-1960s | ~165,000 ancestry | |
| 1850s Shri Pammull, Hindu Sindhi merchant — first named Indian settler | Merchants and hawkers; professionals post-1960s | ~1.4 million+ ancestry | |
| 1850s Dutch seamen and gold-rush miners (no single named first) | Explored 1606-1644 but never settled; East Indies refugees in WWII; mass migration post-1945 | ~380,000 ancestry | |
| 1860s Cameleers and hawkers (no single name recorded) | Early hawkers; skilled migration post-2000s | ~250,000+ (Sikh/Punjabi) | |
| 1860s Ceylonese merchants and hawkers (no single name recorded) | Post-1980s civil-war humanitarian and skilled migration | ~150,000 ancestry | |
| 1870s First Syrian/Lebanese hawkers (no single name recorded) | Hawkers and merchants; wave post-1947 | ~300,000 ancestry | |
| 1871 First Japanese settler recorded 1871 (name not recorded) | Pearl divers at Broome; luggers from 1897 | ~75,000 ancestry | |
| c. 1920 No named first arrival | Skilled and student migration from 1980s | ~120,000 ancestry | |
| 1976 First refugee boats (no single name recorded) | Post-1975 refugee boats and resettlement | ~360,000 ancestry | |
| 1988 First Somali community in Victoria, 1988 (no single name) | Humanitarian resettlement | ~90,000 combined |
The eras behind the table
The 1850s gold rushes brought the first great non-British waves, Chinese miners above all, and set the pattern of chain migration that every later community followed.
After 1945 Australia rebuilt itself with assisted migration: Greeks, Italians, Dutch, Maltese and Croats arrived by the tens of thousands, transforming the country’s idea of itself.
From 1976 the first Vietnamese refugee boats began a resettlement program that became one of Australia’s largest humanitarian chapters.
Since the 2000s the skilled-migration program has driven rapid growth in Indian, Filipino, Chinese and Sri Lankan communities, making them among the fastest-growing in the Census.
Disputed firsts
Some “firsts” are less certain than the table suggests. The 1788 German and Italian rows rest on real but often nameless records — German and Italian convicts sailed with the First Fleet, but no German convict’s name survives, the first named German settler being Johann Justus in 1838. The Indian “first”, the Sindhi merchant Shri Pammull in the 1850s, is the earliest named Indian. The 1818 record of the Chinese settler Mak Sai Ying (John Shying) rests on fragmentary shipping and parish documents, and earlier informal visits may never be recovered. The Maltese “first”, John Pace in 1790, is disputed — the first certain Maltese arrivals were convicts around 1810, and the first free immigrant was Antonio Azzopardi in 1838. For the Filipinos, Japanese, Lebanese, Koreans and Vietnamese, no single first name survives in the archives. Where records are thin, this article says so rather than guessing.
Before every community was a first person, a recorded name, a ship, a year. This is the definitive order of arrival behind the modern Census table.
Video showing slow motion replay of the CHINA NEPAL TIBET FLOOD
Real estate agents across Australia are complaining about the property slump: the REB Top 100 Agents 2025
A lot of these people are surprisingly not all that good looking, given that they need less training than an actual builder and are selling their image; in a downturn should people first try selling their homes privately by listing on real estate portals?
| # | Agent | Company | Volume ($) | Background | Estimate agent commission @1.8% |
|---|---|---|---|---|---|
| 1 | Alexander Phillips | PPD Real Estate | $962,248,740 | · | $17,320,477 |
| 2 | Michael Clarke | Clarke & Humel | $871,922,388 | · | $15,694,603 |
| 3 | Dib Chidiac | DibChidiac&Co | $544,543,764 | Middle Eastern / Lebanese | $9,801,788 |
| 4 | Maclay Longhurst | Sydney Sotheby’s International Realty | $523,564,000 | · | $9,424,152 |
| 5 | Jennifer Carr | Louis Carr Real Estate | $403,119,600 | · | $7,256,153 |
| 6 | James Ball | Sydney Sotheby’s International Realty | $477,996,400 | · | $8,603,935 |
| 7 | Norman So | Belle Property Strathfield | $405,403,964 | Asian (East Asian) | $7,297,271 |
| 8 | Peter Chauncy | McGrath Estate Agents | $362,537,500 | · | $6,525,675 |
| 9 | Helen Yan | Ray White Balwyn | $349,945,287 | Asian (East Asian) | $6,299,015 |
| 10 | Tarun Sethi | McGrath Estate Agents | $386,110,164 | Indian / South Asian | $6,949,983 |
| 11 | Carla Fetter | Jellis Craig Stonnington | $349,041,000 | · | $6,282,738 |
| 12 | Suzanne Hibberd | Abode Property | $384,579,750 | · | $6,922,436 |
| 13 | Michael Kollosche | Kollosche | $594,316,500 | · | $10,697,697 |
| 14 | Andrew Liddell | BresicWhitney | $326,578,500 | · | $5,878,413 |
| 15 | Vivien Yap | Ray White Dalkeith · Claremont | $322,728,057 | Asian (East/SE Asian) | $5,809,105 |
| 16 | Sam Rigopoulos | Jellis Craig Inner North | $320,735,500 | · | $5,773,239 |
| 17 | Alex Jordan | McGrath Estate Agents | $309,405,911 | · | $5,569,306 |
| 18 | Nicole Qiu | Jellis Craig Doncaster | $398,706,439 | Asian (East Asian) | $7,176,716 |
| 19 | Ben Pike | Pulse Property Agents | $311,760,260 | · | $5,611,685 |
| 20 | Adrian Oddi | BresicWhitney | $272,777,000 | · | $4,909,986 |
| 21 | Chris Nunn | BresicWhitney | $271,695,000 | · | $4,890,510 |
| 22 | Matthew Everingham | Richard Matthews Real Estate | $317,535,088 | · | $5,715,632 |
| 23 | Nicholas Wise | Sotheby’s International Realty | $268,592,900 | · | $4,834,672 |
| 24 | Randall Kemp | Ray White The Woollahra Group | $349,085,600 | · | $6,283,541 |
| 25 | Mathew Steinwede | McGrath Estate Agents | $254,807,000 | · | $4,586,526 |
| 26 | David Walker | Ray White Upper North Shore | $291,407,525 | · | $5,245,335 |
| 27 | Sally Cameron | TOOP+TOOP | $256,630,236 | · | $4,619,344 |
| 28 | Tony O’Doherty | McGrath Estate Agents | $233,361,000 | · | $4,200,498 |
| 29 | Ahmad Malas | Melrose Estate Agents | $230,559,888 | Muslim / Middle Eastern | $4,150,078 |
| 30 | Sophie Su | Kay & Burton | $332,505,488 | Asian (East Asian) | $5,985,099 |
| 31 | Calvin Huang | Jellis Craig | $244,063,581 | Asian (East Asian) | $4,393,144 |
| 32 | Eva Xu | Belle Property Epping | $229,512,288 | Asian (East Asian) | $4,131,221 |
| 33 | Shiv Nair | Ray White United Group | $229,348,548 | Indian / South Asian | $4,128,274 |
| 34 | Robert Pignataro | Strathfield Partners | $314,956,458 | · | $5,669,216 |
| 35 | Rawa Norman | DiJones Willoughby | $283,436,888 | Middle Eastern | $5,101,864 |
| 36 | Kel Goesch | Brisbane Real Estate | $221,983,000 | · | $3,995,694 |
| 37 | Catherine Dixon | PPD Real Estate | $249,045,000 | · | $4,482,810 |
| 38 | Dane Queenan | PRD Port Stephens | $266,563,250 | · | $4,798,139 |
| 39 | Betty Ockerlander | McGrath Estate Agents | $227,545,020 | · | $4,095,810 |
| 40 | Simon Noakes | Noakes Nickolas | $273,136,791 | · | $4,916,462 |
| 41 | Andrew Lutze | Cunninghams Real Estate | $217,603,501 | · | $3,916,863 |
| 42 | Craig Lea | McGrath Estate Agents | $224,048,000 | · | $4,032,864 |
| 43 | Michael Kirk | BresicWhitney | $210,211,250 | · | $3,783,803 |
| 44 | Cameron Airlie | N G Farah | $225,755,500 | · | $4,063,599 |
| 45 | Leo Xu | Buxton Balwyn-Canterbury | $213,408,217 | Asian (East Asian) | $3,841,348 |
| 46 | Steven Kourdis | Stone Real Estate Lindfield | $254,435,321 | · | $4,579,836 |
| 47 | Anthony Di Nardo | Belle Property Hunter Region | $217,117,283 | · | $3,908,111 |
| 48 | Ripple Wu | McGrath Estate Agents | $204,144,456 | Asian (East Asian) | $3,674,600 |
| 49 | James Ramsay | Stone Real Estate Beecroft | $211,145,000 | · | $3,800,610 |
| 50 | Stephen Huang | Jellis Craig Monash | $193,511,163 | Asian (East Asian) | $3,483,201 |
| 51 | Nick Papas | Agents and Co Property Group | $184,917,000 | · | $3,328,506 |
| 52 | Troy Dowker | Kollosche | $268,400,388 | · | $4,831,207 |
| 53 | Spring Chen | Fletchers | $188,891,764 | Asian (East Asian) | $3,400,052 |
| 54 | Trent Tarbey | McGrath Estate Agents | $184,649,500 | · | $3,323,691 |
| 55 | Calvin Chan | CHN Real Estate Group | $231,047,775 | Asian (East Asian) | $4,158,860 |
| 56 | Alexandra Stamatiou-Buda | McGrath Estate Agents | $186,668,287 | · | $3,360,029 |
| 57 | James Baker | McGrath Estate Agents | $233,781,920 | · | $4,208,075 |
| 58 | Bill Tsounias | McGrath Estate Agents | $184,864,388 | · | $3,327,559 |
| 59 | Scott Patterson | Kay & Burton | $269,138,888 | · | $4,844,500 |
| 60 | David Alvares | Hoskins Maroondah | $178,751,950 | · | $3,217,535 |
| 61 | Roger Wardy | Ray White Touma Taylor | $206,460,500 | Middle Eastern | $3,716,289 |
| 62 | David Choy | McGrath Estate Agents | $180,596,760 | Asian (East Asian) | $3,250,742 |
| 63 | Bruce Liu | Buxton Wheelers Hill | $178,477,839 | Asian (East Asian) | $3,212,601 |
| 64 | Elliot Gill | Jellis Craig Richmond & Surrounds | $201,265,950 | · | $3,622,787 |
| 65 | Courtney Caulfield | Place Estate Agents Kangaroo Point | $184,613,582 | · | $3,323,044 |
| 66 | Will Torres | Torres Property | $179,335,950 | · | $3,228,047 |
| 67 | Ben Spackman | Raine & Horne Mona Vale | $198,225,000 | · | $3,568,050 |
| 68 | Kevin Dearlove | Stone Beecroft | $181,397,000 | · | $3,265,146 |
| 69 | Matthew Carvalho | Ray White Glebe · Erskineville | $173,848,300 | · | $3,129,269 |
| 70 | Eric Hartanto | Hartanto Properties | $174,288,926 | Asian (SE Asian) | $3,137,201 |
| 71 | Conor Howard | N G Farah | $199,821,500 | · | $3,596,787 |
| 72 | Paul Biller | Biller Property | $213,343,000 | · | $3,840,174 |
| 73 | Chris Hassall | Buxton Glen Eira | $168,191,000 | · | $3,027,438 |
| 74 | James Kaye | Belle Property Strathfield | $213,159,888 | · | $3,836,878 |
| 75 | Emily Davidson | Sydney Sotheby’s International Realty | $198,930,000 | · | $3,580,740 |
| 76 | Dallas Taylor | Jellis Craig Doncaster | $163,577,000 | · | $2,944,386 |
| 77 | Patrick Ivey | Harcourts Property Centre | $166,671,100 | · | $3,000,080 |
| 78 | Drew Davies | Place Estate Agents Ascot | $193,943,000 | · | $3,490,974 |
| 79 | Sam Lloyd | McGrath Estate Agents | $264,903,888 | · | $4,768,270 |
| 80 | Jared Wei | Jellis Craig Monash | $156,817,880 | Asian (East Asian) | $2,822,722 |
| 81 | Nick Clarke | Clarke & Co Estate Agents | $303,539,750 | · | $5,463,716 |
| 82 | Jodie McCarthy | Jellis Craig Richmond & Surrounds | $157,200,000 | · | $2,829,600 |
| 83 | Georgi Bates | Cunninghams Real Estate | $172,852,777 | · | $3,111,350 |
| 84 | Ercan Ersan | Ray White Erskineville | $169,623,000 | Muslim / Turkish | $3,053,214 |
| 85 | Lyndall Allan | Salt Property Newcastle | $156,777,000 | · | $2,821,986 |
| 86 | Matt Morley | Doyle Spillane | $156,325,500 | · | $2,813,859 |
| 87 | Adrian Tsavalas | Adrian William | $155,967,070 | · | $2,807,407 |
| 88 | Patrick McKinnon | Place Estate Agents Ascot | $177,011,000 | · | $3,186,198 |
| 89 | Jeffrey Li | Midland Realty Group | $155,873,400 | Asian (East Asian) | $2,805,721 |
| 90 | Daniel Gonzalez | Realty Lane | $154,318,000 | · | $2,777,724 |
| 91 | Owen Chen | Place Estate Agents Sunnybank | $166,241,752 | Asian (East Asian) | $2,992,352 |
| 92 | Adam McMahon | Dignam Real estate | $158,263,080 | · | $2,848,735 |
| 93 | Peter Diamantidis | Ray White United Group | $263,573,551 | · | $4,744,324 |
| 94 | Jody Fewster | Ray White Cottesloe Mosman Park | $210,498,388 | · | $3,788,971 |
| 95 | Daniel Cook | McGrath Estate Agents | $165,341,888 | · | $2,976,154 |
| 96 | Alex Mintorn | Pello Property | $179,946,000 | · | $3,239,028 |
| 97 | Georgie Todd | Harris Real Estate | $147,093,100 | · | $2,647,676 |
| 98 | Brett Hayman | Hayman Partners | $163,319,200 | · | $2,939,746 |
| 99 | Patrick Lang | Belle Property | $147,974,500 | · | $2,663,541 |
| 100 | Kieran Bresnahan | McGrath Estate Agents | $150,066,869 | · | $2,701,204 |
Nepal-Tibet Flash Flood. 54 US & 34 Australian tourists reported missing, most likely along the Yatra route crossing at Rasuwagadhi
Nepal-Tibet Flash Flood (26 Aug 2026) – Kailash Mansarovar Yatra Route
A glacial outburst surge along the Bhotekoshi / Lhende Khola struck the Rasuwa-Gyirong border corridor. 47-54 US and 34 Australian tourists reported missing, most likely along the Yatra route crossing at Rasuwagadhi / Gyirong Port.
Likely locations of Australian & American nationals reported missing
Primary Route – Kailash Mansarovar Yatra (most likely location for majority of missing tourists)
Kathmandu to Dhunche to Syabru Besi to Rasuwagadhi (28.28N, 85.38E) to Gyirong Port (28.28N, 85.38E) to Saga (29.33N, 85.23E) to Darchen (30.68N, 81.32E) to Mount Kailash (31.07N, 81.31E) to Lake Mansarovar (30.65N, 81.45E).
The flood struck the Rasuwa-Gyirong border corridor where this route crosses from Nepal into Tibet. Tourists would most likely have been in the vicinity of Rasuwagadhi / Gyirong Port (28.28N, 85.38E) or transiting through Syabru Besi (28.16N, 85.34E) and Timure (28.25N, 85.39E) when the Bhotekoshi / Lhende Khola surge hit.
Note: the map’s “Gyirong County (border zone)” marker sits in the southern border zone near Gyirong Port where the flood hit. The 265+ missing were in this border zone.
Secondary Route – Gosaikunda Trek
Dhunche (28.09N, 85.29E) to Syabru Besi (28.16N, 85.34E) to Gosaikunda Lake (28.08N, 85.42E). 62+ Nepali citizens were trekking here during the Janai Purnima festival; some foreign trekkers may also have been present.
Key Flood Trigger Points
- Bhotekoshi River / Lhende Khola: Glacial ice-rock avalanche blocked the river, releasing a sudden surge downstream.
- Trishuli River: Water levels rose by as much as 9 metres in 30 minutes through Nuwakot district.
Brisbane Olympics will be worst financial disaster in Australian Sporting History
Brisbane 2032 Will Be the Worst Financial Disaster in Australian Sporting History
Sydney 2000 is remembered with fondness. The 2018 Gold Coast Commonwealth Games came in on budget. Brisbane 2032 will complete the set in the opposite direction: A$15.5 billion committed, warnings of A$20 billion, and the bill is climbing before a single brick is laid for a two-week party.
Exhibit A: The Bill So Far
Queensland, Australia| Cost Category | Amount |
|---|---|
| Operating budget (OCOG) | ~A$4.9 to 5.8 billionroughly US$3.2 to 3.8 billion, before the inevitable overruns |
| Venue and infrastructure capital | A$7.1 billionroughly US$4.6 billion of stadiums, villages and transport upgrades |
| Combined total budgets | A$15.5 billionroughly US$10 billion, and climbing |
| Expert warnings, ceiling scenario | up to A$20 billionroughly US$13 billion: the number historians may end up writing down |
Spread across Queensland’s population, A$15.5 billion works out to roughly A$2,800 per resident, every man, woman and child, for three weeks of sport.
Exhibit B: Meanwhile, in Beijing
Beijing, China| Cost Category | Amount |
|---|---|
| Estimated annual cost | US$15 to 50 millionan entire international Games: 500 to 2,000+ humanoid robots, global teams, broadcast, security and ceremonies, staged in existing venues |
The Hall of Shame
Where Brisbane sits among the Games that broke the bank
| Games | What It Cost | The Aftermath |
|---|---|---|
| Montreal 1976 | C$1.5 billion debt on a C$120 million original budget | Taxpayers paid it off for 30 years, finally clearing the books in 2006. The original cautionary tale. |
| Athens 2004 | Roughly €9 billion, heavily state-funded | Legacy venues left to rot; the bill helped load the pistol of Greece’s later debt crisis. |
| Rio 2016 | About US$13 billion public and private | Olympic Park largely abandoned within years; a textbook white elephant. |
| Tokyo 2020 | ~US$13 billion official, audited far higher | Almost entirely public money, no spectators, minimal tourism payoff. Quietly one of the costliest ever. |
| Brisbane 2032 (projected) |
A$15.5 billion committed, warnings of A$20 billion+ | Not yet built, yet already outspending every Australian sporting event ever staged. On this trajectory it does not join the Hall of Shame. It tops it. |
Exhibit C: See It for Yourself
Two Games, two spectacles, one on each continent
That is how many times more expensive Brisbane’s Games are than Beijing’s robot games, depending on where each estimate lands. One city hosts a global spectacle for the price of a shopping centre. The other is building a monument to cost inflation.
Two Games, Two Philosophies
One borrows, one builds. Only one risks ruin.
| Brisbane 2032 Olympics | Beijing Robot Games | |
|---|---|---|
| Total cost | ~US$10 to 13 billion | ~US$15 to 50 million |
| Duration | 2 to 3 weeks, one-time | Annual recurring event |
| Venues | 17+ new or upgraded venues across Queensland | 1 to 2 existing Olympic venues (Bird’s Nest, Ice Ribbon) |
| Athletes and participants | ~10,500 human athletes | ~2,000 robots (2026) |
| Infrastructure built | Stadiums, athlete villages, rail and road upgrades | Minimal, uses existing facilities |
Chinese platform www.bilibili.tv/en/ is now global & you can stream the latest hit movie sᴘɪᴅᴇʀᴍᴀɴ 𝗕𝗿𝗮𝗻𝗱 𝗡𝗲𝘄 𝗗𝗮𝘆 for free. Short Netflix
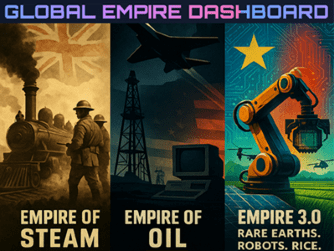
The Sleep of Empires – How the Ottomans Fall at the Gates to Vienna echoes in Britain’s broken factories
In 1529, Suleiman’s army reached Vienna. In 1683, Kara Mustafa besieged it again. The Ottomans commanded the Mediterranean, held the trade routes, and stood close enough to watch European innovation unfold. Yet when the Industrial Revolution ignited in Britain’s workshops, the Sublime Porte looked away. By the time it grasped that steam and mechanization had shifted the balance, the gap was unbridgeable.
Five centuries on, another empire that bestrode the world faces a similar moment. The United Kingdom, birthplace of the first Industrial Revolution, stands at the gates of another revolution, the shift to renewable energy and electric mobility. Like the Ottomans watching manufactures rise from Constantinople, Britain has watched from the sidelines, with the talent, capital, and early warning, yet without embracing the change.
The Ottoman failure to industrialize remains a puzzle. This was no isolated civilization. Its merchants traded in Venice, its diplomats watched the Dutch Republic, its engineers studied European fortification. It had taken the Balkans, threatened Italy, and kept an elite fluent in the continent’s languages and ideas.
Yet when the steam engine, the loom, the blast furnace, and the railway arrived, the Ottoman economy stayed anchored to pre-industrial structures. Several forces bred this blindness.
Institutional Inertia
The Ottoman state ran on guilds, tax-farming, and an army built for conquest, not production. Its very success became a trap, why reorganize around factories when the old order had delivered Constantinople, Cairo, and Budapest?
Economic Entrenchment
Wealth came from land, tribute, and the Asia-Europe trade. That bred a rentier elite. Industrialization threatened guilds, provincial governors, and a clergy suspicious of European technique. The empire extracted value from commerce rather than creating it through manufacture.
The Military-Technological Disconnect
The Ottomans bought European rifles, cannon, and steamships, yet treated them as goods to acquire, not signs of civilizational change. They imported the products of industry without the capital markets, patent law, schools, and enterprise that made them.
By the mid-nineteenth century, when the Tanzimat reforms finally pushed modernization, Europe already led in steel, rail, and arms. The Ottomans saw the revolution from the start but never named it.
If the Ottomans failed as observers, Britain failed as the inventor. It did not merely watch the Industrial Revolution, it wrote it. Watt’s engine, Darby’s iron, and Stephenson’s locomotive were British gifts to the world, and the empire they built ruled a quarter of the globe.
That inheritance makes Britain’s halting response striking. The signs were clear across the Commonwealth. Australia’s rooftop solar now powers most households by day. Canada and New Zealand both set 2035 deadlines for all-electric car sales. India’s production-linked scheme drew tens of billions into solar while its EV market grew yearly. Britain had the universities, the City’s capital, and the engineering heritage to lead.
Instead, the record is hesitation and half-measures.
The Fossil Fuel Hangover
Britain built its supremacy on coal, then North Sea oil and gas, and kept hydrocarbons central long after the warning was plain. Like Ottoman elites living off trade routes, policy-makers clung to extraction. North Sea oil was the empire’s iqta, lucrative, familiar, and a trap that deferred hard reinvestment.
The Financialization Trap
Nothing mirrors Ottoman rentier economics like the rise of the City. As factories faded in the late twentieth century, Britain financed industry abroad instead of building it at home. When the EV shift demanded gigafactories, reshored supply chains, and grid build-out, British capital preferred derivatives to pouring concrete in the Midlands.
Institutional Fragmentation and Political Volatility
Nineteenth-century Ottoman reform drowned in palace intrigue and divided power. Britain’s recent record, Brexit, revolving-door premiers, and energy policy split across jurisdictions, bred the same uncertainty. Transitions need decades of steady policy. Onshore wind was effectively banned in England for years. The ZEV mandate was revised again and again. Strategy swung between intervention and laissez-faire.
The Automotive Apocalypse
The British car industry, once a manufacturing emblem, tells the harshest story. Germany electrified its sector; China built one from scratch; Britain’s output shrank. Britishvolt, its flagship battery firm, failed in 2023 without making a cell. Jaguar Land Rover, Mini, and Bentley now depend on foreign parents for their electric future. The nation that gave the world the combustion engine has become a bit-player in its successor.
There are exceptions. Britain’s offshore wind is world-leading, and Scottish renewables have done well. But the pattern echoes the Ottomans, pockets of adoption without systemic change.
What links these cases across five centuries? An Islamic gunpowder empire and a parliamentary naval power seem unalike, yet their failures share a structure.
The Curse of Early Success
Both succeeded so completely under the old model that they could not imagine its end. The Ottomans took Constantinople and reached Vienna; Britain ruled the waves and the world economy. Civilizational winners struggle to admit the game changed, and their deep memory became a liability.
The Rentier Mentality
Empires that grow rich by controlling trade, colonies, finance, or oil develop habits unlike those who must innovate to survive. The Ottomans taxed commerce; the British financialized it. Neither built the political economy for sustained reinvestment.
Technological Consumerism vs. Technological Production
The Ottomans bought European cannon; the British buy Chinese batteries and German EV platforms. Both treated transformative tech as goods to trade, not ecosystems needing education, supply chains, and cultural change.
The Ideological Barrier
Ottoman religious and military conservatism resisted the social reordering industry required. In Britain, a different conservatism, nostalgia for past glory joined to suspicion of industrial policy, a climate-skeptic media, and a class happier managing decline than driving change, produced the same result. Each elite could not commit because the new order threatened too much.
The Ottoman Empire did not fall for want of intellect or access. It fell because it could not rebuild its society, economy, and self-image around a new source of power. The Industrial Revolution was not a set of machines but a total reordering of production, education, capital, and state.
The renewable and electric revolution is just as total. It is not petrol swapped for batteries or coal for wind, but a reimagining of grids, supply chains, labor, and alliances. It demands building batteries, turbines, electrolyzers, and lines at a scale that calls for the full mobilization of national purpose.
US EMALS Reversal Will Ground Entire Western Allied Drone Carrier Ambitions
Why Japan’s Current Trajectory is a Godsend Strategic Boon for China
For decades, the geopolitical calculus of East Asia has been defined by the friction between China and Japan. Tokyo has long served as the unsinkable aircraft carrier for American hegemony in the Pacific, the lynchpin of the First Island Chain designed to contain Beijing’s maritime ambitions.
However, a convergence of demographic decline, fiscal stress, and currency volatility is rewriting the script and a closer look through the lens of Chinese strategic interests reveals a different picture: Japan’s current situation is developing remarkably well for China.
一Japan and the End of the Liberal Consensus and the Cultural Reset
It was non other than Francis Fukuyama, a Japanese American who declared that “History had ended” and that liberal democracy had won. From a civilizational perspective, the brief flirtation of East Asian societies with Western liberal ideals appears to be ending. Japan, as a core Sinosphere country, is reverting to its cultural mean.
For years, the liberal left in the West viewed Japan with as a frustration, a nation that preferred demographic decline to mass migration. This resistance to the flow of people has been a thorn in the side of Western liberal orthodoxy, which often uses visa policies, university gatekeeping and mainstream media control to maintain a specific cultural consensus.
Japan’s steadfast refusal to dilute its traditional family values and ethnic homogeneity, despite the economic cost, validates a broader civilizational truth: Asian societies are rooted in fundamentally different value systems regarding nationhood and identity.
For China, this is a quiet vindication. It demonstrates that resistance to Western liberal universalism is not solely the domain of the Chinese Communist Party, but a broader cultural instinct within the Sinosphere. As Japan holds the line, it normalizes the concept of sovereign cultural integrity, reducing the ideological pressure on China to conform to Western social models.
二The Sword of US Debt and the Shield of the Yen
The most immediate and tangible benefit for China emerges from Japan’s fiscal dilemma. Japan remains one of the largest foreign holders of US Treasury debt. However, Japan is aging faster than any other industrialized nation. As its domestic workforce shrinks and its savings rate plummets, Tokyo will inevitably be forced to liquidate its foreign assets, primarily US Treasuries, to fund domestic pensions and social security.
This forced selling puts structural upward pressure on US debt yields. For Washington, this is a nightmare scenario, making deficit spending vastly more expensive and constraining its ability to fund its military-industrial complex.
But the mechanism does not stop there. Because Japan is the bridgehead for containing China, the United States cannot allow the Japanese economy to free-fall into chaos. Washington must support the Japanese economy as it contracts. The primary mechanism for this support is the buying up of the Yen to stabilize Tokyo’s purchasing power.
The Strategic Gift
Herein lies the strategic gift to Beijing. When the US acts to support the Yen, the Japanese currency strengthens, and because the Yen is a major component of the Dollar Index, a strengthening Yen directly lowers the Dollar Index, freeing the People’s Bank of China from the tightrope of defending the RMB against a persistently strong dollar.
日元走强,美元指数随之下行,人民币所受的外部压力便悄然消解。
三The Dollar Index and the Liberation of Monetary Policy
A strengthening Yen directly lowers the Dollar Index. For the People’s Bank of China (PBoC), this is a godsend. For years, Beijing has had to walk a tightrope, managing the RMB exchange rate against a persistently strong dollar. A high Dollar Index often forces the PBoC to defend the RMB, limiting its ability to cut interest rates or inject liquidity for fear of triggering capital flight.
With the Yen rising and the Dollar Index subsequently weakening, the pressure on the RMB evaporates. This frees up valuable operational space for the central bank. Expectations of capital outflows from China correspondingly weaken, providing positive external support for Beijing’s ongoing economic recovery. In essence, Japan’s demographic crisis is forcing the US to export monetary easing to East Asia, directly financing the breathing room China needs to stimulate its domestic economy.
四The Great Industrial Handoff
Beyond the macro-level financial flows, a rare window of opportunity has opened at the industry level.
The appreciation of the Yen has severely weakened the price competitiveness of Japanese exports. Japanese manufacturing giants, already struggling with energy costs and supply chain disruptions, are now forced to quote higher prices in US dollar terms. This is an unacceptable situation for price-sensitive markets in Southeast Asia, the Middle East, and Africa.
Consequently, Chinese manufacturers are stepping in to fill the void. For years, Chinese firms have been moving up the value chain, competing directly with Japanese heavy industry, machinery, and automotive products. The Yen appreciation has accelerated this handover. In the battle for global market share, the currency tailwind is now behind China, allowing Chinese exporters to absorb orders that were previously locked in by Japanese suppliers.
Simultaneously, the stronger Yen creates a counter-intuitive benefit for Chinese exports to Japan itself. The increased purchasing power of the Japanese consumer means that imported Chinese goods, ranging from machinery and electrical products to light industrial goods and agricultural produce, are now relatively cheaper and more attractive in the Japanese market.
五Conclusion: A Strategic Reprieve
History is rarely static. For decades, China’s rise was checked by the reality that Tokyo held the keys to the Asian financial kingdom and stood as the anchor of US containment strategy.
Today, the tectonic plates are shifting. Japan’s demographic decline and its role as a creditor to a debt-laden United States are creating an environment where American policy must inadvertently subsidize Chinese monetary freedom. At the same time, the normalization of cultural conservatism in Japan chips away at the moral high ground of Western liberal internationalism.
The path ahead for China remains fraught with challenges, but looking Eastward, the view is clearer than it has been in decades. As Japan navigates its structural decline, the geopolitical and economic dividends are quietly accruing to Beijing. Japan, once the blade pointed at China, is becoming the whetstone upon which China sharpens its own strategic advantage.
What’s wrong with Penny Ying-Yen Wong?
She has an East Asian name and an East Asian face, yet she does not speak a single East Asian language and can barely communicate with an entire side of her own family.
Raised white, married white, raising her children white, and having spent her entire career in the white monoculture of Canberra, she nevertheless condemns any suggestion of a monoculture.
She has advocated for LGBT rights throughout her life, yet has never seriously advocated for Asian rights — consistently placing her sexuality ahead of her cultural heritage.
She should go back to Malaysia and learn some Chinese so she can reconnect with her ancestors’ culture.
As Foreign Minister she does not appear to recognise that the Chinese-Australian community might have any useful role in shaping national security policy — yet somehow $150 million in donations to secret offshore trust accounts will keep Australia safer.