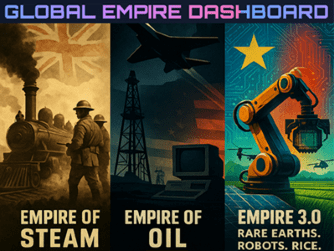
Global Empire Dashboard

We Are Closed. Australia has become corrupted by a corrosive mix of nihilism and embraced a radical liberal ideology that celebrates the rejection of anything from the past that could stabilise society including any inheritance of previous forms of culture. You just have to look at the abuse thrown towards our staff in the past few years to realise this, what is old is no longer deemed necessary & indeed something that must be replaced. We had no choice but to close.

Welcome to Foodstar

Why Social cohesion is harder to sustain in migrant societies. At home, hunger is cushioned by extended kinship networks offering food & shelter. In migrant contexts, the absence of these ties, means deprivation often erupts into protest

🛖 Home societies: hunger has a cushion
In many home countries, extended family and communal ties work like invisible welfare systems. If someone is hungry or out of work, they can turn to cousins, uncles, or village elders for food, shelter, or small loans. These networks are rooted in kinship, reciprocity, and trust built over generations.

🏙️ Migrant societies: hunger has no safety net
For migrants, whether in sprawling cities or diasporic communities abroad, those ties are weakened or lost. Families are scattered, neighborhoods anonymous, jobs precarious. When desperation hits, there’s no uncle to call, no village to lean on. The street becomes the only option.

🔥 Why protests erupt
This is why food riots and protests often break out not in the poorest rural villages, but in migrant-heavy urban slums. It’s not about who is poorest in absolute terms: it’s about who has had their coping mechanisms stripped away. Hunger here doesn’t stay private; it spills out collectively.

🧩 The invisible glue of stability
Social stability isn’t just about income levels. It’s about the invisible infrastructure of trust, kinship, and mutual aid that helps people survive when the state or market fails. Remove that glue, and hunger becomes a spark.

Every nation is now being sorted into three camps, shaped by oil refining capacity and the pace of electrification.

1. Refining Electro-states 🟢

(Countries that still refine oil, but have decided to electrify demand)

They could keep burning diesel, but the spreadsheet now says electrons are cheaper.

These 40 countries, from Chile to South Korea, possess enough refining capacity to meet their own gasoline needs, yet have locked themselves into net-zero laws, EV mandates and grid-scale renewables.

Their strategic payoff is currency independence: every terawatt-hour they generate is a dollar they do not need for crude imports.

2. Petro-states 🟠

(Countries whose fiscal survival still hinges on crude refining or exports)

They have to earn dollars today to buy the refined products tomorrow, and that keeps the U.S. dollar at the centre of world trade.

This group ranges from Saudi Arabia to Canada and includes the United States itself because the USD is the petro-currency.

Their risk is the electrification shock: every extra EV sold in Germany or India is one less barrel that Riyadh or Alberta can sell.

3. Non-refining Electro-states 🔵

(Countries that literally cannot turn crude into gasoline)

They import every litre of diesel, priced in dollars they do not print.

This is the largest single block, from Morocco to Mongolia, Uruguay to Zambia, and the fastest growing. Because they have zero refining capacity, electrification is not an environmental luxury, it is balance-of-payments survival.
Governments are reallocating capital from buying gasoline to building solar-plus-storage once Chinese EVs and batteries became cheaper than oil.

Bottom Line

The next few decades will not be decided by who has the most oil, but by who has the cheapest electrons and the shortest dollar-denominated oil bill. Countries without refineries are discovering they can leapfrog straight to electrified economies financed by the green side. Countries with refineries must decide: monetise the last barrel or monetise the first kilowatt-hour.

📰 Cronos Coin (CRO) EXPLOSION: Trump, Saudis, and a $25 BILLION pipeline to Pakistan

Cronos (CRO) just erupted from $0.15 to $0.38 in TWO DAYS, adding a jaw-dropping $6 BILLION to its market cap. This is about Trump, oil money, and a secret financial pipeline stretching from Saudi to Pakistan.

💣 THE TRUMP CONNECTION

Donald J. Trump’s media empire, Truth Social and pals, just rolled out a $6.4 BILLION CRO war chest.

  • 💰 $1 BILLION already dropped to buy CRO (nearly 20% of the supply!)
  • 🏦 $5 BILLION credit line from Wall Street’s Yorkville SPAC
  • 🔗 CRO becomes the official token for Trump’s media platforms

Trading volume? SKYROCKETED 2,000% overnight. The three-year CRO bear market is DEAD.

🇸🇦 SAUDI OIL MONEY → 🇵🇰 PAKISTAN PIPELINE

Here’s where it gets wild:

  • 💰 Saudi Arabia’s PIF pledges $25 BILLION to Pakistan for mines, power, and refineries
  • 🏦 A $2B Saudi deposit unlocked a $3B IMF bailout for Pakistan in May 2025
  • 🔗 Trump’s son-in-law Jared Kushner is right in the mix, through his firm Affinity Partners (which took $2B from PIF)

This isn’t just money. It’s a crypto corridor for Gulf cash to move FAST and OFF-SWIFT.


🔥 CRO IS THE MIDDLEMAN

1️⃣ Saudi PIF funnels money through Affinity Partners
2️⃣ Yorkville SPAC injects funds into CRO reserves
3️⃣ CRO powers Truth Social micro-payments
4️⃣ Cash exits into Pakistan via Crypto.com UAE exchange

💡 Translation: CRO = Gulf Oil → Pakistani Copper → Digital Dollars
This is $25B of real-world money, and CRO is the keyhole it’s going through.

This isn’t Dogecoin 2.0. CRO is the linchpin in a $25 BILLION oil-to-crypto pipeline, with Trump as the wildcard power broker. Follow the crypto wallets. Follow the planes. Follow the coin.

Africa might be the first place where people skip straight from 🔥 fire to 🌞 renewables in just one generation.

♟️ The Energy Meta-Game

History’s plot twists aren’t driven by kings or ideologies they’re in fact driven by energy. Every leap, fire, horse muscle, steam, oil, sunlight rewrites how we live, work, and govern. In Australia, this spans from Dreamtime to Microgrids.:

  • 🔥 Dreamtime Fire: Aboriginal peoples used fire to hunt, shape country, and sustain communities. Control of the flame meant control of life, law, and ceremony.
  • 🐎 Convicts & Horses: The First Fleet relied on muscle, horses, sails, and convict labour to survive. Life revolved around rules, labour, and navigating beaches as borders.
  • ⚙️ Coal & Steam: Time becomes money
  • 🛢️ Holdens & Electricity: Post-war suburbs, cars, and electricity relied on oil and power grids.
  • 🌞 Renewables & Microgrids: Solar panels, wind farms, and microgrids let towns and rooftops generate and trade energy independently.

The rule never changes: find a denser, cleaner, more controllable energy gradient, and build your institutions around it before the next mob does it better.

📊 Rupert Murdoch is the 24th-most-read Australian page on Wikipedia; Anthony Albanese is 162nd. That 138-place chasm tells you more about the country than any poll.

🌏 Australia is the only country in the world where a retired 94-year-old media mogul is drawing four times the attention on Wikipedia compared to the person who supposedly runs the government.

  • 📰 Policy is downstream of page-views. When Murdoch’s outlets frame a story, Wikipedia follows, because editors cite the loudest available source. The tail wags the dog.
  • 🤖 Algorithm gravity. Google’s Knowledge Panel for “Australia politics” still surfaces Murdoch’s bio ahead of Albanese’s on mobile. That isn’t neutrality; it’s inherited SEO

If 🚨43,000 folks rock up to March for Australia rally this weekend, 👮‍♂️Victoria Police capacity will be exhausted.

Weekend availability pool
65 % of 14 000 sworn 👮‍♂️Victorian Police officers =
9 100 officers.

Fixed commitments
Routine weekend demand = 6 500
Porepunkah man-hunt for Desi Freeman = 300
Total fixed = 6 800

Remaining officers available for surge duties
⚡9 100 – 6 800 = 2 300 officers

📊Police-to-crowd ratio (double staffing for weekend shift rotations)
2 officers per 37.5 protesters = 2 / 37.5 ≈ 0.0533 officers/protester.

🔢Maximum crowd the 2 300-officer buffer can cover
2 300 ÷ 0.0533 ≈ 43 125 → ≈ 43 000 protesters

Therefore, 43 000 protesters in the Melbourne March for Australia rally would use the entire 2 300-officer buffer, exhausting all remaining police capacity in Victoria.

When the Nanny State Pivoted from Cars to Pouring Concrete: “25 Years On, Hair’s Whiter, But is Anyone Wiser?” 🕰️🤔

MELBOURNE – MAJOR PROJECTS SCORECARD (Transport & Water)

Project Promised Cost / Date Final (or latest) Cost / Date Cost Blow-out Delay Value for Taxpayers Grade Notes (BCR = Benefit Cost Ratio)
CityLink (Stages 1 & 2) $1.8 b / 1999 $2.5 b / 2000 1.4× 1 yr B Concession to Transurban; now seen as positive NPV despite toll hikes.
Western Ring Road (M80) upgrades 2007–2022 $1.9 b / 2012 $3.8 b / 2022 2.0× 3 yrs C Delivered in 5 packages; some sections on time, overall 40 % over.
Regional Rail Link $3.8 b / 2013 $4.3 b / 2016 1.1× 1 yr C Auditor-General: BCR 0.9; patronage 30 % below forecast.
East West Link (cancelled) $6–8 b / 2018 $1.3 b *spent* F $1.3 b spent, zero infrastructure delivered.
Melbourne Metro Tunnel $9 b / 2016 $13.48 b / 2025 1.5× 4 yrs C Auditor-General 2023: revised BCR ~1.2.
West Gate Tunnel $5.5 b / 2022 $10–12 b / 2025 1.8–2.2× 3 yrs C PFAS contamination drove >$3 b blow-out; BCR now <1.0.
Level Crossing Removal (55 sites) $5–6 b / 2022 $8.3 b / 2023 1.4× 1 yr B Program BCR 1.8; delivered 40 % faster per site than historical average.
North East Link $10–15 b / 2027 $26.1 b / 2028 1.7× 1 yr C Business-case BCR 0.7; scope inflation (longer tunnels).
Melbourne Airport Rail $5 b / 2026 $10 b / 2029 (on hold) 2.0× 3 yrs+ F Scope & alignment still changing; not yet contracted.

MELBOURNE – BROAD INFRASTRUCTURE SCORECARD (Buildings)

Project Promised Cost / Finish Final (or latest) Cost / Finish Cost Blow-out Delay Value for Taxpayers Grade Notes (BCR = Benefit Cost Ratio)
Victorian Desalination Plant $3.1 b / 2011 $5.7 b + $18–19 b contract / Dec 2012 6.1× 1 yr F Drought insurance facility; never run at full capacity until 2017; adds $608 m p.a. to water bills even when idle.
Federation Square $135 m / 2000 $450 m / Oct 2002 3.3× 2 yrs B 8 m visitors p.a.; prime civic and cultural asset.
Docklands Redevelopment $7–8 b (1996) $14.6 b / ongoing 1.9× 25 yrs+ D 190 ha renewal; land value uplift >$10 b; criticised for poor public realm.
New Footscray Hospital $1.2 b / 2022 $1.495 b / 2025 1.25× 3 yrs B 504-bed tertiary teaching hospital; first green-star public hospital in Victoria.
Joan Kirner Women’s & Children’s Hospital $200 m / 2021 $220 m / 2023 1.1× 0 yrs A 200-bed women’s & paediatric centre; now state’s 2nd-largest maternity hub.
Australian Institute for Infectious Diseases $300 m / 2025 $400 m / 2026–27 1.3× 1 yr B 10-storey super-lab; pandemic R&D hub next to Melbourne Biomedical Precinct.
Royal Children’s Hospital Redevelopment $1.0 b / 2011 $1.3 b / 2011 1.3× 0 yrs B International award-winning paediatric facility; BCR 2.1 post-opening.
Royal Melbourne Hospital Royal Park $250 m / 2012 $350 m / 2016 1.4× 2 yrs C 200-bed acute tower; emergency dept doubled.
Peter MacCallum Cancer Centre $1.0 b / 2015 $1.2 b / 2016 1.2× 1 yr A Co-located with RMH; integrated oncology hub; BCR 2.4.
Melbourne Convention & Exhibition Centre Stage 2 $205 m / 2018 $235 m / 2018 1.15× 0 yrs B 9 000-seat plenary hall; major events generator.
Melbourne Conservatorium of Music $110 m / 2019 $160 m / 2022 1.45× 2 yrs C University of Melbourne; world-class acoustic halls.
State Library Victoria Vision 2020 $88 m / 2019 $91 m / 2020 1.03× 0 yrs A Heritage-sensitive expansion; 40 % jump in visitation.
Melbourne Arts Precinct Transformation $1.4 b / 2025 $1.8 b / 2025 1.3× 0 yrs B New NGV Contemporary, Arts Centre spire & public realm.
Big Housing Build $5.3 b / 2024 $5.7 b / 2024 1.07× 0 yrs A 12 000 new dwellings; 30 % delivered on budget.

🎶 Taylor Swift’s Love Life & Songbook 📖❤️A timeline of boyfriends, breakups, and the iconic songs they inspired from high-school crushes to stadium lights.

1. Drew Dunlap – early high school 🎓💔

Song: “Tim McGraw” 🎶
A wistful goodbye to a summer love ending as he leaves for college; she hopes hearing “Tim McGraw” will always remind him of her.


2. Jordan Alford – high school ex 🚗🔥

Song: “Picture to Burn” 🔥
Fiery break-up anthem aimed at a cocky, lying redneck ex; she gleefully lists every reason she’s torching the memory of him.


3. Sam Armstrong – cheated on her 💔🚫

Song: “Should’ve Said No” 🚫
A scathing call-out to the boyfriend who cheated; the chorus hammers home that a simple “no” could have saved them both.


4. Joe Jonas – summer 2008 ☎️🎤

Song: “Forever & Always” ⏱️
Rapid-fire piano pop that captures the sting of his 27-second break-up phone call and the whiplash of promises turned to dust.


5. Taylor Lautner – late 2009 ❄️🦋

Song: “Back to December” ❄️
A rare apology song; she regrets letting a sweet, caring guy slip away and wishes she could rewind to the snowy night she hurt him.


6. John Mayer – late 2009/2010 🎸🕳️

Song: “Dear John” 🎤
Slow-burning six-minute takedown of an older, manipulative ex who strung her along with twisted mind games.
Song: “The Story of Us” 📖 also reflects the fallout.


7. Jake Gyllenhaal – late 2010 🧣🍂

Song: “We Are Never Ever Getting Back Together” 🚪
Bubbly, chant-along pop kiss-off to his yo-yo romance; she slams the door on their endless on-and-off cycle.
Song: “All Too Well” 🧣 dives into the raw heartbreak of their brief but searing relationship.


8. Conor Kennedy – summer 2012 🏞️☕

Song: “Begin Again” 🌅
Gentle café-ballad about cautiously opening her heart to a new guy after the bruises of past love.

9. Harry Styles – late 2012–early 2013 🌪️✨

Song: “Style” 😎
Sleek, synth-laced ode to the magnetic pull she still feels for a stylish ex whose “James Dean” looks and reckless charm keep them orbiting back.
Song: “Out of the Woods” 🌲 chronicles the anxiety and turbulence of their whirlwind romance.


10. Calvin Harris – 2015–June 2016 🎧💔

Song: “I Don’t Wanna Live Forever” 🌙
Brooding duet about craving an ex who’s already moved on; mirrors the messy end with him.
Song: “Getaway Car” 🚗💨 (indirectly) tells how she used a rebound to escape this relationship, only to crash later.


11. Tom Hiddleston – June–Sept 2016 🎭🇬🇧

Song: “Getaway Car” 🏎️
Noir-ish story of using a rebound fling to escape another relationship and realizing the getaway car always crashes.


12. Joe Alwyn – 2016–early 2023 🇬🇧❤️

Song: “Lover” 💍
Dreamy, romantic waltz that paints six years together as a golden, private world built for two.
Song: “Cruel Summer” ☀️ channels the delirious thrill of falling for him in secrecy.
Song: “So Long, London” 🌧️ is a haunting elegy to the quiet unraveling of their relationship; she walks alone through the city that once felt like home.


13. Matty Healy – May–June 2023 fling 🎤🥀

Songs: The Tortured Poets Department ✒️📜
Lyrically dense and conflicted, reflecting a whirlwind fling full of chaos, self-destruction, and fascination.


14. Travis Kelce – late 2023–present 🏈✨
Engaged soon to be Husband

Song: “The Alchemy” 🏆
Packed with football metaphors (touchdowns, trophies, winning streaks) mirroring his Super Bowl season and their budding romance.
Song: “So High School” 🏫🎸
Nostalgic pop-rock rush that captures the giddy, teenage-movie vibe of their early days together, complete with a playful nod to Kelce’s old “marry-kiss-kill” interview answer about her.

While accusations of anti-Semitic attacks by Iran may have a protective veneer, the direct security benefit to the local community is limited.

Politically, these accusations are often leveraged to normalize interventionist foreign policy ie. to prepare the ground for Australian involvement in a potential war with Iran.

🌐 The Great Internet Flip: How the Same Wires That Hollowed Out the Bible Belt Super-Charged Hindutva and Political Islam

🕍 In rural Alabama, empty pews signal the decline of Christianity.
🕌 In South Asia and the Middle East, digital platforms are fueling Islamic revival.
🕉️ In India, Hindutva nationalism thrives in WhatsApp groups and meme wars

It isn’t divine intervention; it’s incentives + architecture. Where religion was a monopoly, the internet introduced competition and people walked.
Where religion was an underdog insurgency, the net handed it distribution at scale and people eagerly adopted its teachings.

1. 🏛️ How the Bible Belt Churches Lost Its Lock-In

• For decades, Southern churches were the establishment the default authority in faith, community, and politics.
• But higher education + the internet exposed young Southerners to alternatives: secular ethics, pluralism, new lifestyles.
• Once the monopoly broke, belief collapsed.
👉 Religion lost its grip precisely because it was the default.

Old World (Pre-Internet)New World (Post-Internet)
One pastor → one town50 YouTube apologists → one feed
3 TV channels defer to church📺 3M subreddits roast evangelicals
“Because I said so” authority🎥 Netflix exposes scandals in high-def
Church = social hub + dating pool❤️‍🔥 Tinder, Discord, Peloton replace every function

The internet didn’t kill God. It turned faith into a commodity. 📱 TikTok exvangelicals livestream their deconversions
Once salvation had to compete in the open market, streaming, therapy culture, and parasocial communities outbid the church.
Weekly attendance: 1990 → 70% 2025 → 22%.

2. 🚀 Algorithmic Megaphone: Global Ummah Islam & Hindutva 2.0

Islam

  • Before → Friday khutbah filtered by state-approved imam
  • After → Mufti Menk reels hit 10M views; Telegram groups mobilize Dua campaigns within minutes of Gaza headlines
  • Narrative shift → “The West is lying about us again
  • Virality hack → outrage travels Jakarta → Istanbul → Dearborn in one retweet.

Hindutva

  • Before → RSS shakhas: 20 men in a park at 6 am
  • After → Modi’s 92M Twitter followers + 200K BJP WhatsApp groups = every smartphone becomes a pocket shakha
  • Narrative shift → “Global CEOs with Hindu names prove civilizational greatness
  • Shares faster than fact-checks can load.

3. 🎓 One Internet, Two Curricula

American CampusesIndian & Muslim-Majority Campuses
Critical theory, gender studies, evolutionary biologyIITs + Aligarh Muslim U = STEM maximalism, conservative humanities
Dorms teach pluralism & doubtDorms teach pride & grievance
Outcome → “Religion? Meh.”Outcome → “Religion? Weaponize it.”

The same login leads to completely opposite operating systems.

  • Southern Christians thought the net would spread the gospel to every nation.
    → It did. But it also let every nation fact-check the gospel.
  • Islamists & Hindutva feared the net would westernize their youth.
    → It did. Then the youth used those same tools to western-proof their identities.

4. ⚖️ Authority Architecture: Pyramid vs. Swarm

  • Church → Pyramid. One pastor’s scandal = brand collapse.
  • Islamic & Hindu influencers → Swarm. 10,000 micro-preachers. Cancel one, 9,999 keep pumping.

The internet punishes hierarchy but rewards swarm behavior. Guess which religions were natively swarm-compatible?

5. 🗳️ State Power as UX: Faith Becomes the Interface

  • 🇺🇸 Southern Evangelicals → married to GOP → culture-war fatigue
  • 🇮🇳 Hindutva → married to BJP → wins feel holy
  • 🌍 Political Islam → resisting the “West” → virality feels heroic, the Ummah lives on

The algorithm amplifies whoever makes faith feel like participation.

Most Profitable Films Ever (Theatrical + Downstream Revenue)

Shown with estimated downstream revenue (home-video, TV, music, merchandise, theme parks)

RankFilm💰 Worldwide Gross 2025 inflation adj.🎬📀🎶🎢 Est. Downstream Revenue🏆 Est. Net Profit
1 🇺🇸Avatar (2009)$2.92 B$2.3 B (DVD/BD, 3D TV, merch, Pandora – Animal Kingdom)≈ $1.56 B
2 🇺🇸Avengers: Endgame (2019)$2.80 B$1.4 B (EST/VOD, Disney+, licensing, merch)≈ $0.99 B
3 🇨🇳Ne Zha 2 (2025)$2.20 B$600 M (China digital, TV, soundtrack, toys, theme-parks in planning)≈ $0.91 B
4 🇺🇸Frozen (2013)$1.29 B$1.9 B (DVD/Blu-ray, TV, soundtrack 10× platinum, merch > $5 B retail, Frozen Ever After ride)≈ $0.80 B
5 🇺🇸Avengers: Infinity War (2018)$2.05 B$1.1 B (merchandising, licensing)≈ $0.76 B
6 🇺🇸Titanic (1997)$2.26 B$1.7 B (home-video reissues, TV, soundtrack)≈ $0.73 B
7 🇺🇸The Avengers (2012)$1.52 B$1.0 B (merchandising, streaming/licensing)≈ $0.71 B
8 🇺🇸Jurassic World (2015)$1.67 B$900 M (merchandise, home-video, TV rights)≈ $0.70 B
9 🇺🇸Avatar: The Way of Water (2022)$2.32 B$1.0 B (early digital, 3D Blu-ray, Disney+ window)≈ $0.69 B
10 🇺🇸Spider-Man: No Way Home (2021)$1.92 B$900 M (home-video, merch, streaming licensing)≈ $0.68 B

Notes:

  • 💰 Worldwide Gross: Box office revenue from theatrical release.
  • 🎬📀🎶🎢 Downstream Revenue: Home-video, TV licensing, streaming, music, merchandise, theme parks.
  • 🏆 Net Profit: (worldwide gross + downstream revenue) – (production budget + P&A + distribution fee)

Twenty years ago, 🇨🇳 China’s stock markets were only a third the size of the 🇬🇧 British Commonwealth. Today, the tables have turned.

🇨🇳 China SE Total Stock Market values August 2025

EntityMarket Cap
China (SSE + SZSE)$19.36 T
Hong Kong (HKEX)$0.95 T
China + Hong Kong≈ $20.3 T
Commonwealth (Top 5)≈ $15.9 T
Full Commonwealth (56 nations)≈ $18.5 T

Source https://www.marketcapwatch.com/all-countries/

🇬🇧 British Commonwealth nations SE Total Stock Market values August 2025

CountryMarket Cap
India$5.21 T
United Kingdom$4.23 T
Canada$3.64 T
Australia$1.98 T
Singapore$0.83 T
Other 40+ members≈ $2.6 T

🎯 The Bottom Line

  • China + Hong Kong: ≈ $20.3 T
  • Commonwealth (56 nations): ≈ $18.5 T

🚨 Historic first: Empire 3.0 (China) has officially overtaken Empire 1.0 (British Commonwealth).

EmpireFlagCore Narrative2025 Cap2005 Cap
Empire 1.0🇬🇧 CommonwealthSteam & Colonies≈ $18.5 T≈ $11 T
Empire 2.0🇺🇸 United StatesOil & Silicon $67.8 T≈ $15 T
Empire 3.0🇨🇳 ChinaRobots & Renewables≈ $20.3 T≈ $3.5 T

📉📈 The Déjà-Vu Ratio

YearEmpire 3.0 (China + HK)Benchmark EmpireRatio
2005≈ $3.5 TCommonwealth ≈ $11 T≈ 30%
2025≈ $20.3 TUSA ≈ $67.8 T≈ 30%

The echo: still ~30% — but the reference empire shifted from Commonwealth → United States.