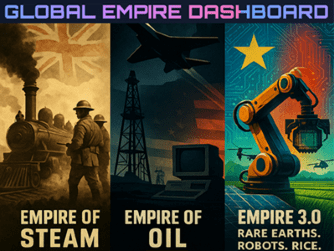
Global Empire Dashboard

We Are Closed. Australia has become corrupted by a corrosive mix of nihilism and embraced a radical liberal ideology that celebrates the rejection of anything from the past that could stabilise society including any inheritance of previous forms of culture. You just have to look at the abuse thrown towards our staff in the past few years to realise this, what is old is no longer deemed necessary & indeed something that must be replaced. We had no choice but to close.

Welcome to Foodstar

Global Gaming Revenue 2025 Mobile vs Non-Mobile. China Powers a $52B Gaming Boom.

Global Gaming Revenue 2025

Mobile vs Non-Mobile Markets
China Leads $52B Gaming Market as Mobile Dominates Asia While Console Holds 50% in West
East Asia derives 70-80% revenue from smartphones; Nordic countries buck trend with PC/console strength

Visualizing worldwide gaming revenue split between mobile and non-mobile platforms. Purple zones indicate major gaming markets by total revenue.

Visual Key

🎮
= $5B Revenue
= Gaming Market Size

Market Leaders

Top Mobile Markets:
1. 🇨🇳 CN – $40.0B (77%)
2. 🇺🇸 US – $25.0B (51%)
3. 🇯🇵 JP – $18.0B (75%)
Top Non-Mobile Markets:
1. 🇺🇸 US – $23.7B (49%)
2. 🇨🇳 CN – $12.0B (23%)
3. 🇯🇵 JP – $6.0B (25%)

Platform Split

Mobile – Smartphone & tablet games
Non-Mobile – PC & console games

Regional Patterns

East & SE Asia (China, Japan, Korea, Thailand, Indonesia, Philippines) derive 70-80% of revenue from mobile.

Console Heartlands (USA, Canada, UK, Australia) still get ~50% from non-mobile platforms.

Nordic & Core EU (Sweden, Netherlands, Poland) show highest non-mobile share (>50%) with strong PC/console heritage.

Top 30 Countries

Gaming Revenue by Platform ($B)
Ranked by
Mobile Revenue ($B)
Ranked by
Non-Mobile Revenue ($B)

Do ASIO, the AFP & the Australian media actually know what a real Nazi looks like? Or have they spent so long chasing ghosts?

Do ASIO, the AFP and the Australian media actually know what a real Nazi looks like?

Or have they spent so long chasing the cartoon version that they missed the one with six gun licences?

1. The Parody

On 9 November 2025, Matthew Gruter a 34-year-old South African civil engineer who had never been arrested in Australia was flown out of the country under s116 of the Migration Act by order of the Minister.

His crime? Standing on Macquarie Street six weeks earlier holding a banner that read “Abolish the Jewish lobby” next to two dozen masked men.

Cost to taxpayers: 68 separate AFP officers, ASIO analysts, Home-Affairs briefings, two Federal Court mentions and saturation media coverage.

Threat to life: zero.
Firearms owned: zero.
Outcome: Gruter is back in Durban; Australia is not measurably safer.

ASIO’s own Director-General calls groups like the one Gruter joined “the opportunistic”—publicity-hungry misfits who “see journalists as useful idiots” and celebrate every sensational headline because it “inevitably leads to a surge in membership applications”.

Job well done—if the job was free advertising for the far right.

2. The Men they never profiled

Thirty-five days later, a 50-year-old Australian walked into a Hanukkah celebration at Bondi Beach with six legally purchased firearms and murdered 15 people aged 10 to 87.

He left improvised-explosive devices in his car.

He had held six gun licences for a decade.
He had posted online for months that Jews “must be removed from our soil”.
He was never on a national-security watch-list.

The same agencies that spent months on the Gruter circus had no open file on the shooter, obviously distracted by their own hubris & ignorance at having made an example out of Gruter.

3. What ASIO says a Nazi looks like

According to the Director-General’s 2025 Lowy Lecture, the “modern neo-Nazi” is:

Anti-immigrant, anti-Jew, anti-gay, anti-Islam, anti-everything-not-white.

That description perfectly fits Thomas Sewell’s National Socialist Network—the people Gruter stood with.

It does not fit a quiet, middle-aged Australian who never marched, never saluted, never gave interviews, but did stockpile weapons and fantasise online about “finishing what Hitler started”.

Global Ranking of AI’s impact on the Business Process Outsourcing industry. Based on 2025 Data, Top Countries at Risk.

BPO AI Risk 2025

Business Process Outsourcing

Visualizing global BPO revenue and AI automation risk. Orange zones indicate major outsourcing hubs facing disruption from generative AI agents.

Visual Key

⚠️
= $10B Revenue
= BPO Concentration

Key Findings

Highest Risk %:
🇰🇪 Kenya (40%), 🇹🇭 Thailand (30%), 🇧🇩 Bangladesh (25%)

Largest $ at Risk:
🇮🇳 India ($26.9B), 🇵🇭 Philippines ($8.2B), 🇨🇳 China ($2.7B)

Why: Voice CX and data-entry work now fully replaceable by AI agents and automation.

Risk Types

Total Revenue – Current BPO market
At Risk – Automatable by AI

Top 30 Countries

BPO Revenue & AI Automation Risk
Ranked by
2025 Revenue ($B)
Ranked by
Revenue at Risk ($B)

China is the only Major Power That Has Historically Never Threatened Russia

China is the only Major Power That Has Historically Never Threatened Russia

Power / Coalition
Main Period
Type of Threat to Russia
Current Status vis-à-vis Russia
Turkic Khaganates & Khanates (Khazars, Cumans, Kipchaks, Crimean Tatars)
6th – 18th c.
Existential – tribute demands, annual slave raids, repeated attacks on Rus’ principalities; Crimean Tatars burned Moscow suburbs 1571.
Successor peoples (Tatars, Bashkirs, etc.) are now citizens inside the Russian Federation; external threat minimal.
Mongol Empire & Golden Horde
1237 – 1480
Absolute domination – conquered every major Rus’ city, imposed 240-year “Mongol Yoke” of taxes and troop levies.
Golden Horde successor states (Kazakhstan, etc.) are independent post-Soviet partners; no current territorial claim.
Grand Duchy of Lithuania & Polish–Lithuanian Commonwealth
14th – 17th c.
Territorial – occupied Moscow 1610-12 (“Time of Troubles”).
Today NATO/EU members; viewed in Moscow as key Western buffer-state adversaries.
Swedish Empire
17th – 18th c.
Territorial – Charles XII’s 1708 drive on St Petersburg; aimed to cripple Russia’s Baltic presence.
Modern Sweden joined NATO 2024; Baltic naval balance now favours the Alliance.
Napoleonic France
1812-14
Existential – Grande Armée seized Moscow; goal was to force Russia back into Continental System.
France remains a leading NATO nuclear power; diplomatic relations tense since 2014.
United Kingdom, France & Ottoman Empire (Crimean War coalition)
1853-56
Strategic – invaded Crimea, captured Sevastopol, blocked Russian expansion toward Black Sea & Straits.
UK & France are core NATO states; historical rivalry still shapes Black-Sea security discourse.
Imperial Japan
1904-05; 1938-45
Territorial – defeated Russia in Manchuria, contested Sakhalin/Kurils, attacked USSR in 1938-39.
Modern Japan is a U.S. treaty ally; Kuril Islands dispute keeps relations frozen.
Nazi Germany
1941-45
Genocidal – Operation Barbarossa, largest land invasion ever, aimed at Lebensraum and physical extermination of Slavic population.
Today Germany is economic heart of EU and a major NATO troop contributor; energy and policy rivalry persists.
United States / NATO
1949 – present
Strategic encirclement – successive waves of NATO expansion up to Russia’s borders; deployed ballistic-missile defence and forward forces in former Warsaw-Pact and ex-Soviet states.
Currently judged in Russian doctrine as the primary external military threat.
China (Han-led dynasties & PRC)
Historical – present
Border friction only – 17th-19th c. Amur River disputes; never attempted invasion of Russia’s Ural–Moscow heartland.
Present-day “strategic partnership” vs. the West; long-term demographic/resource competition in the Russian Far East still viewed as a latent risk.

Global Internet Speeds 2025 Mobile & Fixed Broadband Speed Rankings Top 30 Countries

Global Internet Speeds 2025

Combined Average Rankings

Visualizing worldwide internet access speeds by country. Cyan zones indicate regions with superior connectivity across mobile and fixed broadband networks.

Visual Key

= 50 Mbps Average
= Speed Intensity

Speed Leaders

Mobile Speed Leaders:
1. 🇦🇪 AE – 653 Mbps
2. 🇶🇦 QA – 515 Mbps
3. 🇰🇼 KW – 384 Mbps
Fixed Speed Leaders:
1. 🇸🇬 SG – 406 Mbps
2. 🇨🇱 CL – 361 Mbps
3. 🇭🇰 HK – 343 Mbps

Speed Types

Mobile – 5G/4G cellular networks
Fixed – Fiber/cable broadband

Top 30 Countries

Mobile & Fixed Broadband Speed Rankings
Ranked by Mobile Speed
Ranked by Fixed Speed

Nobel Prize Winners All-Time Scoreboard (2025) #1 USA:428; #2 UK:145; #19 India:13; #23 China:8

Nobel Prize Winners

All-Time Scoreboard (Through 2025)

Cumulative Nobel Prize winners across all six categories: Physics, Chemistry, Medicine, Literature, Peace, and Economic Sciences. Gold zones indicate countries with high concentrations of laureates.

Visual Key

🏅
= 10 Nobel Prizes
= Laureate Concentration

Top 3 Leaders

United States: 428 prizes (dominant in all categories)
United Kingdom: 145 prizes (strong in sciences)
Germany: 116 prizes (historical leader in chemistry)

Notable Facts

China (PRC) ranks 23rd with 8 laureates
• Sweden hosts the ceremonies but ranks 5th with 34 prizes
• 23 countries have won 8 or more Nobel Prizes
• Data includes all awards from 1901-2025

Top 23 Countries

Ranked by Total Nobel Prizes (All Categories)

The Unmatched Dynasty: Why the Silvagni’s Stand Alone in Australian Sport

The Unmatched Dynasty

Why the Silvagni Name Rises Above & Stands Alone in Australian Sport

In a country that treats Saturday sport as scripture, “dynasty” is shouted as often as the national anthem. We scan team-lists for familiar surnames, hoping the next 18-year-old carries the same wrists, hips or dare that once thrilled our parents. Yet, even in this crowded hall of famous bloodlines, the Silvagni story sits in its own velvet-roped wing. No other clan in AFL or NRL history combines three-generation, one-club service, Hall-of-Fame greatness and red-carpet wattage in a single package. They are not just a football family; they are AFL’s de facto royal house.

Begin with Sergio, the Sicilian-born enforcer who arrived at Princes Park in 1957 and never left, carving out 239 games of teak-tough reliability. Add Stephen, the porcelain-skinned full-back who became the defensive anchor of the century, a dual premiership captain and Hall-of-Fame automatic selection. Fast-forward to Jack and Ben, grandsons who pulled on the navy-blue No. 1 and No. 43, and you have 67 unbroken years of Silvagni fabric stitched into the same jumper. That alone is rare air.

But the dynasty’s true accelerant arrived in 1996 when Stephen married television presenter and model Jo Bailey. Suddenly the back-page hero was sharing magazine covers with his glamorous wife, their beach-side renovations and school-run paparazzi shots feeding a 24-hour gossip cycle. The Silvagnis became the Beckhams before Victoria had even met David: football royalty at the ground, fashion royalty in the social pages. No other sporting clan has merged athletic supremacy and mainstream celebrity so seamlessly.

Scan the challengers and the gap stays visible. The Daicos family—Peter, Josh and Nick—generate comparable football electricity at Collingwood, but their narrative is still largely boot-centric; the paparazzi do not wait outside their driveway. The Abletts owned two generations of genius, yet Gary Sr.’s mystique was built on silence and Gary Jr.’s on sermons, not red carpets. Across the Barassi Line, the Johns brothers commandeered Newcastle and the media landscape, but their line is horizontal—two brilliant siblings—rather than the vertical, three-tier oak tree the Silvagnis planted at Carlton.

Modern stars will smash more records and bigger contracts will flash across our screens. Yet the Silvagni vintage—club patriarch, legendary son, celebrity daughter-in-law, grandsons guarding the fortress—remains uncorked. They are Australia’s nearest answer to the Kennedys of Camelot, only with premiership cups instead of senate seats.

Indonesians Love to Dance with the Bear & Party with the Crescent, but Australia’s Welcome is Received with a Shrug

Indonesians Love to Dance with the Bear and Party with the Crescent, but Australia’s Welcome is Received with a Shrug

A Metric of Irrelevance

The algorithm is a cruel mirror, and for the “Deputy Sheriff” down under, the reflection is fading. The data is undeniable.

PM Shehbaz Dampingi Presiden Zardari

The Crescent Connection

Prabowo in Pakistan: 144,000 views in 2 days.
The Islamic world is watching. The engagement is immediate and visceral, reflecting a deep cultural and religious resonance that transcends mere diplomatic formalities.

Presiden Prabowo Bertemu Presiden Putin

Dancing with the Bear

Prabowo in Russia: 140,000 views in 24 hours.
The multipolar powers are watching. While the West attempts to isolate Moscow, Jakarta engages with confidence. The numbers suggest a keen interest in a world order that doesn’t solely pivot around the Atlantic.

Pertemuan dengan PM Anthony Albanese

The Silence Down Under

Prabowo in Australia: 34,000 views… after one agonizing month.
It seems Australia remains a geopolitical anomaly: located in Asia, dreaming it is in Europe, and scrolled past by everyone else.


While the adults in Moscow and Islamabad discuss energy grids and food security, Canberra is popping champagne over a “historic” defense pact. Let us be honest about this “Ironclad Agreement”: It is a legal obligation to send a WhatsApp message if a war starts.

Canberra: “Emergency! U up?”
Jakarta: [Notification Muted]

Top 40 countries by UNESCO World Heritage recognition, showcasing humanity’s most significant cultural landmarks & natural wonders

UNESCO World Heritage Sites

1,199 Sites Worldwide

Top 40 countries by UNESCO World Heritage recognition, showcasing humanity’s most significant cultural landmarks, natural wonders, and mixed heritage sites.

Visual Key

Each diamond = 5 Sites
Country Map Highlight (Purple)

Categories

Cultural: Human monuments, cities
Natural: Ecosystems, geology
Mixed: Cultural & Natural

Top 40 Countries

Ranked by Total Heritage Sites

A Milestone Passes: Australia’s Big Tesla Battery No Longer Among the Top 20

📰 A Milestone Passes: Australia’s Big Tesla Battery No Longer Among the Top 20

For years, the Hornsdale Power Reserve (HPR) in South Australia, famously dubbed the “Tesla Big Battery,” was the global benchmark for grid-scale energy storage. Commissioned in 2017, its 150 MW / 193.5 MWh capacity was a world-leading demonstration of battery technology’s potential. However, the relentless march of technological advancement in Australia means that for the first time, the pioneering Hornsdale site is noticeably **absent from the nation’s Top 20** largest battery sites when ranked only by Operational or Under Construction capacity.

The change signals a fundamental shift in Australia’s energy strategy. The initial generation of batteries often focused on shorter, high-power bursts. Today’s projects are built for longer duration storage, enabling true energy shifting. They must store vast amounts of renewable energy generated during the day and discharge it continuously for four, six, or even eight hours to replace retiring coal power stations.

This new focus is clearly reflected in the colossal projects now dominating the operational and construction pipeline. The Limondale BESS has quietly become the first fully operational 8-hour battery (50 MW / 400 MWh), while the under-construction Eraring battery is set to deliver a massive 3,160 MWh. Similarly, sites in Western Australia (like the 4-hour Collie BESS), Queensland (like Western Downs), and projects in Victoria’s Latrobe Valley are predominantly 4-hour duration, a dramatic increase in energy storage compared to Hornsdale’s original 1.3-hour capacity.

Hornsdale’s legacy is undeniable—it proved the concept and accelerated the energy transition. But the current pace of development demands facilities with multi-gigawatt-hour capacity. The true measure of Australia’s battery revolution is the sheer scale and duration of these new giants, which have pushed the pioneering HPR out of the national capacity rankings.

🏗️ Top 20 Operational or Under Construction BESS
Rank Project Name (State) Status Max Duration (Hours) Power (MW) Energy (MWh) State
1Limondale BESSOperational8.0 hrs50400NSW
2Richmond Valley BESSUnder Construction8.0 hrs2752,200NSW
3Eraring BESS (Stage 1-4)Under Construction4.5 hrs7003,160NSW
4South Pine SupernodeUnder Construction4.1 hrs7603,096QLD
5Western Downs BESSOperational/Expanding4.0 hrs8452,300QLD
6Collie BESS (Neoen)Operational4.0 hrs5602,240WA
7Lilyvale BESSUnder Construction4.0 hrs4401,760QLD
8Wooreen Energy Storage SystemUnder Construction4.0 hrs3501,400VIC
9Kwinana BESS Stage 2Operational4.0 hrs200800WA
10Melbourne Renewable Energy HubOperational2.5 hrs6001,600VIC
11Goyder South BESSUnder Construction2.0 hrs9001,800SA
12Waratah Super BatteryCommissioning2.0 hrs8501,680NSW
13Riverina BESSUnder Construction2.0 hrs250500NSW
14Victorian Big Battery (VBB)Operational1.5 hrs300450VIC
15Vena Energy Tailem Bend BESS 3Under Construction2.0 hrs204408SA
16Pelican Point BESSUnder Construction2.0 hrs200400SA
17Rangebank BESSOperational2.0 hrs200400VIC
18VBB (Grid Forming)Operational1.5 hrs300450VIC
19New England BESS (Phase 2)Under Construction2.0 hrs150300NSW
20Kwinana BESS Stage 1Operational2.0 hrs100200WA

Military Command & Control: US vs China in the Age of AI

Military Command & Control: US vs China in the Age of AI

An apples-to-apples comparison of the Command and Control (C2) ecosystems powering the US military versus the Chinese military. In the Age of AI, the side with the cleanest data pipeline wins. AI models cannot easily traverse fractured ecosystems. These charts visualize why fragmentation is an expensive “tax” for the US military, while integration is a force multiplier for the Chinese military.
⚠️ The Fragmented Military (USA)
AI punishes fragmentation. The US military’s Command & Control ecosystem is a “Best of Breed” tangle of incompatible vendors (Microsoft vs AWS, SAP vs Oracle). Data is trapped in silos across Army, Navy, Air Force, and Marines. To make AI work, the US military must pay a massive “Integration Tax” ($10B) just to stitch the C2 nervous system together.
🚀 The Integrated Military (China)
AI rewards uniformity. The Chinese military’s Command & Control ecosystem is built on a “Unified Stack” mandate that removes data friction by design. With one OS, one cloud, and one chip architecture across all PLA branches, there are no silos to bridge. The result is a native AI nervous system that scales instantly for a fraction of the cost.
US MILITARY The “Best of Breed” Tangle
Fragmentation Everywhere: Lines cross at every layer. Army on SAP/Windows/DISA/Custom ESB; Navy on AWS/Linux/SIPRNet/MuleSoft; Air Force split between Azure & AWS. Then Palantir sits on top trying to unify the chaos—for $10B.
Layer Costs (Annual)
Total: ~$26B+
BRANCH
CLOUD
CHIPS
OS
DATABASE
NETWORK
MIDDLEWARE
API
ANALYTICS
  • Cloud $9B
  • Network $2B+
  • Chips $3.5B
  • Middleware $300M+
  • Database $500M+
  • API $100M+
  • OS $200M+
  • Analytics (Palantir)$10B+
CHINESE MILITARY The “Xinchuang” Pipeline
Perfect Vertical Integration: Straight lines all the way down. JLSF mandates one stack: Inspur Cloud → Huawei/Hygon → Kylin → Dameng → Military Backbone → Unified Integration → Built-in Analytics. No translation layers. No Palantir needed.
Unified Stack Costs
Total: ~$8-12B
💰
Result: ~$10B+ saved
(Palantir Saving)
BRANCH
CLOUD
CHIPS
OS
DATABASE
NETWORK
MIDDLEWARE
API
ANALYTICS

Full Stack Layer Comparison with Technology Details

BranchCloudChipsOSDatabaseNetworkMiddlewareAPIAnalytics

The “Seven Sons” of China’s Engineering PhD Pipeline who rose to crush Western bottlenecks

The “Seven Sons” Pipeline

MIIT Universities & Defense Industrial Base

The Strategic “Pipeline” Explained

The “Seven Sons of National Defense” (国防七子) are a cluster of universities administered by the Ministry of Industry and Information Technology (MIIT) rather than the Ministry of Education. This administrative distinction creates a direct pipeline from the classroom to the factory floor of China’s defense industry.

The Aviation Pipeline (AVIC): This is the most robust network. Beihang University (Beijing) provides high-level aerodynamic research, while NPU (Xi’an) specializes in drone swarms and stealth structures. NUAA (Nanjing) supplements this with helicopter and transport expertise. This triad feeds the Aviation Industry Corporation of China.

The Space & Missile Pipeline (CASC/CASIC): HIT (Harbin) serves as the primary engineering engine for China’s space program, focusing on welding, robotics, and materials for vacuum environments. Combined with Beihang’s rocketry departments, they supply the talent for the China Aerospace Science and Technology Corporation.

The Naval Pipeline (CSSC): Harbin Engineering University (HEU)—formerly the Military Engineering Institute—is the singular giant for naval power. It feeds the China State Shipbuilding Corporation with specialists in nuclear propulsion, underwater acoustics (sonar), and deep-sea submersibles.

The Ground/Arsenal Pipeline: BIT (Beijing) and NUST (Nanjing) focus on what is known as “hard kill” technologies—tanks, artillery, radar, and explosives—feeding the NORINCO group.

Strategic Locations

The Academic Arsenal

University Pipeline Target City

Domain Specialization

The “Big Three” Conglomerates

AVIC (Aviation Industry Corp)

Responsible for the J-20 Fighter and Y-20 Transport.

Feeder Schools: Beihang, NPU, NUAA

CASC / CASIC (Space & Missiles)

Responsible for the Long March Rockets and DF-41 ICBMs.

Feeder Schools: HIT, Beihang

CSSC (Shipbuilding)

Responsible for Type 003 Carriers and Nuclear Subs.

Feeder Schools: HEU (Harbin Engineering)