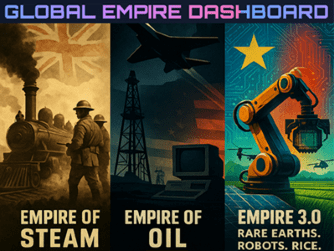
Global Empire Dashboard

We Are Closed. Australia has become corrupted by a corrosive mix of nihilism and embraced a radical liberal ideology that celebrates the rejection of anything from the past that could stabilise society including any inheritance of previous forms of culture. You just have to look at the abuse thrown towards our staff in the past few years to realise this, what is old is no longer deemed necessary & indeed something that must be replaced. We had no choice but to close.

Welcome to Foodstar

Geological Determinism: The Coal, Iron & Streel pipes behind the G7 Developed Nations

Geological Determinism: The Dirty Secret Behind the G7

If you look closely at the formation of the G7, you won’t find a club built on shared ideology. You’ll find a club built on geology.

There was a fundamental “entrance exam” for Great Power status in the 20th century: Domestic Coal + Domestic Iron = Steel = Military Power.

The nations that passed this exam are the ones that rule the world today. Here is the true, geological origin of the heavy industry supply chains that built the modern world.

1. The Naturals (Easy Mode)

These nations sat on the geological jackpot: massive deposits of Coal and Iron located in the same valleys.

  • UK: The pioneer. Had coal (Wales) and iron (Midlands) side-by-side. They didn’t need a navy to secure their supply chain; it was under their feet.
  • USA: The giant. The Pittsburgh Seam (Coal) and Mesabi Range (Iron) connected by the Great Lakes allowed them to out-produce the world without crossing an ocean.
  • USSR: The fortress. With the Donbas (Coal) and Krivoy Rog (Iron) in Ukraine, they achieved total autarky, capable of building 50,000 tanks without foreign trade.

2. The Aggressors (The Annexation Economy)

These nations had Coal but lacked Iron. To complete the formula, they used their armies.

  • Germany: The modern German border has no iron. But in 1871, Germany annexed Alsace-Lorraine from France to capture the massive “Minette” iron fields. Their industrial might was built on a stolen supply chain.
  • Japan: Possessing coal but zero iron, Japan didn’t just “import” ore; they colonised it, seizing mines in China and Korea to feed the Yawata Steel Works.

3. The Adapters & Latecomers

  • France: Iron-rich but coal-poor, they became structurally dependent on German coal, driving the creation of the EU to secure energy access.
  • Italy: Lacking both resources, they innovated early with Electric Arc Furnaces, recycling scrap metal to fake superpower status.
  • South Korea & China: The Asian giants arrived late, proving that with massive ports and modern logistics, you could import the geology you lacked—if you had the scale.

4. Curse of the 51st State

  • Canada: The “Industrial Satellite.” It sits on the geology of a superpower but functions industrially as the 51st State—a power that is wealthy but not truly sovereign.

Summary: The Geological Lottery

Country Coal Source Iron Source The “Secret Sauce”
UK Domestic Domestic Geological proximity (Coal & Iron together).
USA Domestic Domestic Internal river/lake transport network.
Germany Domestic Annexed 1871 Border change captured the iron.
France Imported Domestic Political dependence on neighbours.
USSR Domestic Domestic Total self-sufficiency (Autarky).
Japan Domestic Imperial Military expansion secured the supply.
Italy Imported Scrap Engineering efficiency + Recycling.
S. Korea Imported Imported Maritime Efficiency (Mills on the dock).
China Domestic Imported Scale (Cheap power + Global ore).
Canada Domestic Domestic Integration (Northern wing of US industry).

Conclusion: The “G7+3” Monopoly

Hence, the world is still ruled by these “G7+3” geopolitical entities.

The list of industrialized powers is effectively frozen. The G7 (US, UK, Germany, France, Italy, Japan, Canada) plus the three challengers (Russia, China, South Korea) represent the only nations to master the coal-steel cycle before the door closed. Because the environmental, economic, and military costs of building a heavy industrial base from scratch are now prohibitively high, this list is unlikely to grow. We live in a world permanently governed by the geological winners of the 20th century.

The Chinese Electric mobility future OS “Civil War” mapped according to Clan Groups.

The Chinese EV OS “Civil War”

While Zuck and Meta incinerated $70 billion chasing avatars & the AR/VR headset OS future, China’s automakers are quietly spending $3 billion annually to claim the actual default OS for electric mobility. Some manufacturers are pragmatically forking Android Auto to appease Western markets, but Four ambitious clans are building vertically-integrated ecosystems.

Flow: Tech Clan → Fiefdom (Parent Co) → OS Layer → Car Brands

The Clans & Fiefdoms of Chinese Auto (Full List)

Clan Fiefdom Brands OS Name Notes

Oct ’25 Global Electricity Demand: Who uses the most power & how much of their grid relies on renewables.

Global Electricity

Sep 2025 Data

Corrected Generation Mix including Nuclear Power. (Sep 2025 for all, Pakistan Aug 2025).

Visual Key

1. Bar Length = Total Demand
China
USA
2. Bar Color = Source Mix
● Renew ● Nuclear ● Fossil
Map Color (Total Demand)
Low TWh High TWh

Top Energy Consumers

Ranked by Demand | Bar shows Mix

2025 Global Institutional Research Rankings, Powered by Nature Index Data Telemetry

2025 Research Leaders

Global Institutional Rankings based on Nature Index data telemetry

The 2025 Research Leaders are based on Nature Index data from 1 January 2024 to 31 December 2024.

The metrics of Count and Share used to order Nature Index listings are based on an institution’s or country’s publication output in 145 natural-science and health-science journals.

Map Legend

█ Red Stacks
Height represents total national Share.
Globe Color:
Brighter regions indicate higher research output intensity.

Top Nations

Ranked by Total Share (2024)

2025 UN Funding Shafted: America Does a $1.5B Dine-and-Dash, Leaving the World to Pay for Its Free Lunch

The UN Shafted:
US Does a Dine & Dash on UN Funding 2025

Leaving the rest of the world to pay for the American free lunch in 2025.

The 2025 Crisis: The UN is facing its worst liquidity crisis in years, forcing severe budget cuts and threatening core operations worldwide.

The Deadbeat: The US is the primary cause, withholding over $1.5 Billion in assessed dues, effectively weaponizing its contributions.

The Contrast: While Washington abstains, others step up. China paid its full ~$686M regular assessment in October 2025, filling the leadership void.

⚠️ US Arrears (Unpaid)
$1.5 Billion

Visual Key

The Deadbeat (Owing)
Paid in Full
Member State Contribution

Visualizing the Combined Valuation (Public Market Cap + Private Unicorn Value) of the world’s top City Wide technology ecosystems.

Global Tech Power 2025

Total Valuation: ~$43 Trillion

Mapping the world’s most dominant tech ecosystems by Combined Valuation (Public Market Cap + Private Unicorn Value).

Visual Key

1 Block = $1 Trillion USD
(Height = Economic Power)
Name $100B
= Private Unicorn
Name $100B
= Public Company

Dominance Tiers

TIER 1 The Giants (> $5T)
San Francisco ($25.6T) & Seattle ($6.7T). The “Cloud & AI” capitals control the vast majority of global tech value.
TIER 2 The Trillion Club
Austin, NYC, Beijing, Shenzhen. Cities with >$1T valuation, driven by EVs, Finance, and Mobile Internet.

The Top 19 List

Ranked by Combined Valuation (USD)

U.S. Troops Abroad 2025 ~171,500 Personnel, legit best Call of Duty cosplayers in history. Here’s where they are all stationed.

U.S. Troops Abroad 2025

~171,500 Personnel Overseas

End-of-year snapshot showing U.S. active-duty personnel at permanent or rotational sites outside the United States. Data from DoD June 2025 release.

Visual Key

= 2,000 Troops
= Deployment Intensity

Regional Distribution

Indo-Pacific: ~80,000 troops across Japan (54K), S. Korea (24K), Australia, Philippines, Singapore.

Europe: ~63,000 troops with major hubs in Germany (36K), Italy (13K), UK (10K).

Middle East: ~37,000 troops in Qatar, Kuwait, Bahrain, UAE, Iraq, Syria.

Africa: ~4,000 at Camp Lemonnier, Djibouti (AFRICOM’s only permanent base).

Top 29 Host Nations

Ranked by Troop Strength (≥100 personnel)

THE 🐺WOLF PACK of the South Pacific. 5000 yrs before Europeans arrived in the Pacific, someone built an outrigger canoe and set sail from Fujian/Taiwan carrying pigs & taro & conquered all the Islands.

THE 🐺WOLF PACK of the South Pacific
5000 years before Europeans arrived, on the coast of Fujian, someone built a canoe. 🌊 Mission: A handful of proto-Austronesians pushed off as WOLF scouts. 🐺 The Wolf-Pack: Every island became a new den. 🐉 The PRC: The mother wolf pack is now the People’s Republic of China. 🏗️ New Canoe: Belt-and-Road

Global Car Production 2025 est. 78M Units Worldwide. #1 China | #2 U.S. | #3 Japan

Global Car Production 2025

Est. 78M Units Worldwide

Visualizing the world’s automotive manufacturing by country. Purple zones indicate major production hubs with high output volumes.

Visual Key

🚗
= 2 Million Vehicles
= Production Intensity

Regional Highlights

Asia-Pacific: China dominates with 33M units (42% of global output), producing 40%+ of world’s EVs.

Americas: USA (11M), Mexico (3.8M), and Brazil (2.9M) serve regional USMCA + LatAm markets.

Europe: Germany leads EU with 4.5M units, 75% exported globally.

Top 14 Producers

Ranked by 2025 Production (Million Units)

Putin Wastes Two Days in India

Putin Wastes Two Days in India

Putin has just wrapped up his two-day state visit to India and flown back to Moscow. Indian media went into full devotional mode, flooding the airwaves with hymns about the “time-tested”, “unbreakable” Russo-Indian friendship, complete with slow-motion footage of bear hugs and garlands.

What actually happened? Absolutely nothing of substance.

The two big-ticket items that had been hyped for months — nuclear power cooperation and the Su-57 fighter jet deal — ended exactly where they started: in the realm of “intentions”, “dialogue” and “future roadmaps”. Translation: zero contracts, zero timelines, zero commitments.

Especially hilarious was the Su-57 file. India’s position, delivered with a straight face, is that past cooperation with Russia was so unpleasant that this time New Delhi must lead the entire programme. Demands on the table:

  • 100% technology transfer of every critical system
  • 100% local production in India
  • Right to independently replace every single component with Indian-made alternatives
  • Russia keeps none of the IP and just gets a royalty whenever India sells the jet to third countries

In other words, Russia is expected to hand over the complete crown jewels of its fifth-generation fighter programme — engines, radars, stealth coatings, EW suites, the works — to a country that still cannot manufacture a reliable 5.56 mm assault rifle after thirty years of trying.

If I were Russian, I would politely suggest the Indian delegation visit the nearest neurology ward.

No nation on Earth has ever transferred an entire fifth-generation fighter technology stack to another country, not even the United States to its closest allies. Yet India, whose most advanced “indigenous” fighter still uses an American engine, Russian radar, Israeli avionics, French missiles and a British ejection seat, genuinely believes Russia will just gift-wrap the Su-57 and say “enjoy”.

Meanwhile, the Indian Air Force is running out of both aircraft and time. Pakistan has already signed for the J-35, and India’s own AMCA “stealth fighter” remains a very impressive PowerPoint that keeps getting better with every passing year while staying firmly on the ground.


Let us recall India’s proud history of indigenous aerospace miracles:

  • The Tejas LCA: fifty years in development, still trickles off the production line at four airframes a year, crashes regularly, and has never once engaged a Pakistani aircraft in combat despite multiple opportunities.
  • The Dhruv helicopter: another “world-class” product that drops out of the sky with monotonous regularity.
  • The Arjun tank, the Kaveri engine, the INSAS rifle… the list of national embarrassments is longer than the waiting list for a Tejas delivery.

By the time the AMCA actually flies (optimistic estimate: 2045–2050), China will be flight-testing sixth-generation fighters and Pakistan will have moved on to whatever comes after the J-35.

The only other option is to beg Washington for the F-35. Good luck with that. Trump is back in the White House, and he has already slapped 50% tariffs on India, publicly mocked Modi for losing dogfights to Pakistan, and made it clear that India is no longer America’s favourite “counterweight” to China — that honour now goes to… China itself. Trump calls Xi “my friend” and floats G2 ideas while treating Modi like a particularly slow Uber driver who still owes him a tip.

Top Global Stock Exchanges by IPO Proceeds in 2025. #1.HKEX #2.Nasdaq #3.NYSE

Global IPO Markets 2025

Year-to-Date Capital Raised

Visualizing the world’s leading stock exchanges by IPO proceeds. Blue zones indicate major capital markets with high public offering activity.

Visual Key

$
= $5 Billion IPO Proceeds
= Market Activity (Choropleth)

Market Highlights

Asia-Pacific: HKEX leads globally with $25.5B, India’s combined NSE+BSE hits $15.8B.

Americas: US markets (Nasdaq + NYSE) total $42.5B in tech and energy deals.

EMEIA: Euronext and Tadawul show strong regional growth.

Top 20 Exchanges

Ranked by IPO Proceeds (US$ Billions)

Global Car Manufacturer 2025 End of Yr Sales Telemetry & Analysis

Grand Prix 2025

Car Manufacturer 2025 Sales Telemetry & Analysis
Sector 1: Attack Mode (Surging)
Pos Constructor Origin Sales (YTD) Delta % Race Engineer Notes
1 AITO (HIMA) FASTEST CHN 498,900 ▲ 89% Huawei alliance exploding. Tech-heavy M7/M9 SUVs crushing premium rivals.
2 Xiaomi CHN 315,000 NEW Production constrained, not demand. Stealing “cool factor” from Tesla.
3 Geely CHN 2.48M ▲ 47% Tech leader. “Thor” hybrid & “Short Blade” battery statistically beating BYD.
4 Leapmotor CHN 536,100 ▲ 75% Budget EV king. Capitalizing on affordable segments ignored by majors.
5 Buick USA 156,000 ▲ 14% Surprise US surge via fresh crossovers (Envista) for budget buyers.
6 Genesis KOR 58,830 ▲ 13% Chipping away at German dominance with fresher designs and value.
7 Chery CHN 2.56M ▲ 11% “Silent Giant.” Flooding S. America, Russia, and Australia with SUVs.
8 BYD CHN 4.18M ▲ 11% Decelerating from +62%. Maintaining P1 globally through price cuts.
9 Lexus JPN 270,000 ▲ 9% Benefiting from “EV Cool-down.” Buyers returning to premium hybrids.
10 Toyota JPN 8.70M ▲ 4.5% Immovable giant. Hybrid strategy winning while EV-only brands stumble.
Sector 2: Yellow Flag (Lagging/Crisis)
Pos Constructor Origin Sales (YTD) Delta % Race Engineer Notes
1 Dodge USA 73,600 ▼ 38% Freefall. Killed best-sellers before replacements were ready. Empty lots.
2 Alfa Romeo ITA 4,778 ▼ 30% Struggling to find foothold. Failed to connect with premium buyers.
3 Jaguar GBR 6,560 ▼ 29% “Zombie Brand.” Ceased combustion production for EV pivot. Sales void.
4 Maserati ITA 3,750 ▼ 26% Pricing themselves out. New Grecale not offsetting sedan losses.
5 Li Auto CHN 362,097 ▼ 18% Major reversal. Huawei (AITO) stealing their specific “EREV SUV” niche.
6 Porsche DEU 198,000 ▼ 11% Shock drop. Supply chain issues + difficult Macan EV transition.
7 Nissan JPN 2.80M ▼ 6.0% Critical condition. Collapsing in China. Financially fragile.
8 Chrysler USA 90,732 ▼ 6.0% One-car brand (Pacifica). No new metal. Bleeding market share.
9 Audi DEU 1.19M ▼ 4.8% Caught in middle. EVs not selling; gas SUVs aging. Losing to BMW/Merc.
10 VW DEU 6.60M FLAT Down 4-8% in profit centers (China/US). Forcing factory closures.